YOU ARE LEARNING:
Calculating Amounts

Calculating Amounts
Data about organism abundance can be analysed using different techniques, including calculating different values and making graphs.
What simple rectangular device can be used to help estimate the population size of grass growing on a field?

When we have recorded data in an ecological survey, we need to analyse it to find patterns and to make comparisons with other areas or from other times to find changes etc. The three most common methods to use are means, modes and medians.
The arithmetic mean is often referred to as the average of a set of data.
You will have come across the idea of an average in maths and science before.
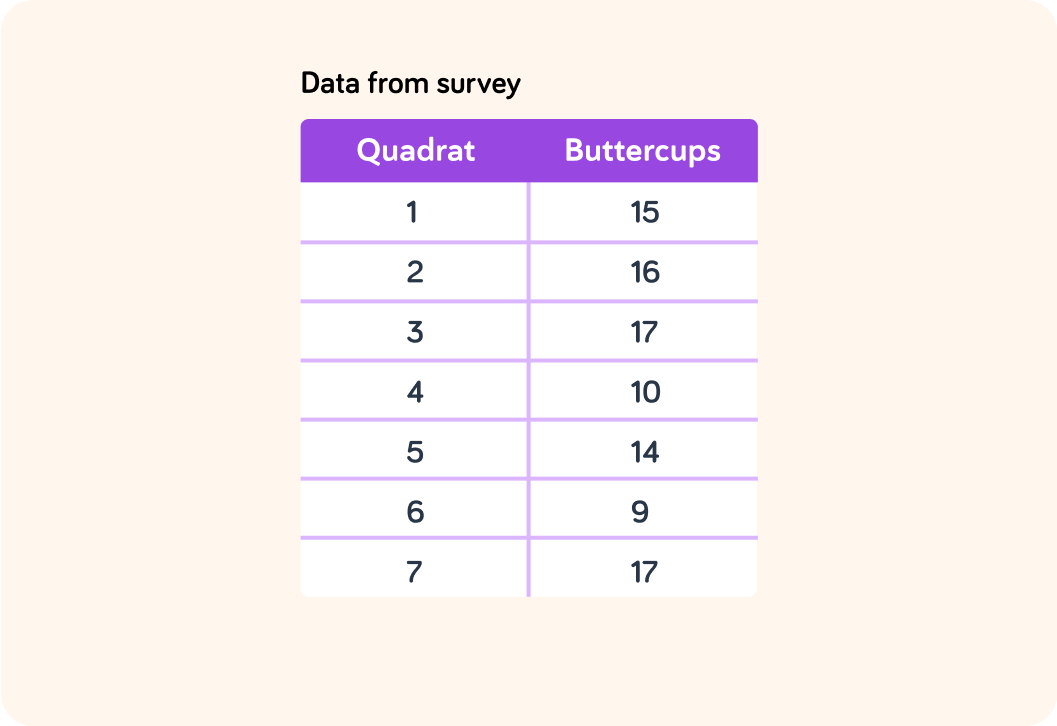
What is the mean value of the data from the buttercup survey given above? You will need to do some addition and some division.
Pick the correct formula for how you worked out the mean.
A) B) C)
Take a close look at this data on the number of dandelions in this field survey.
The mode value for this data is
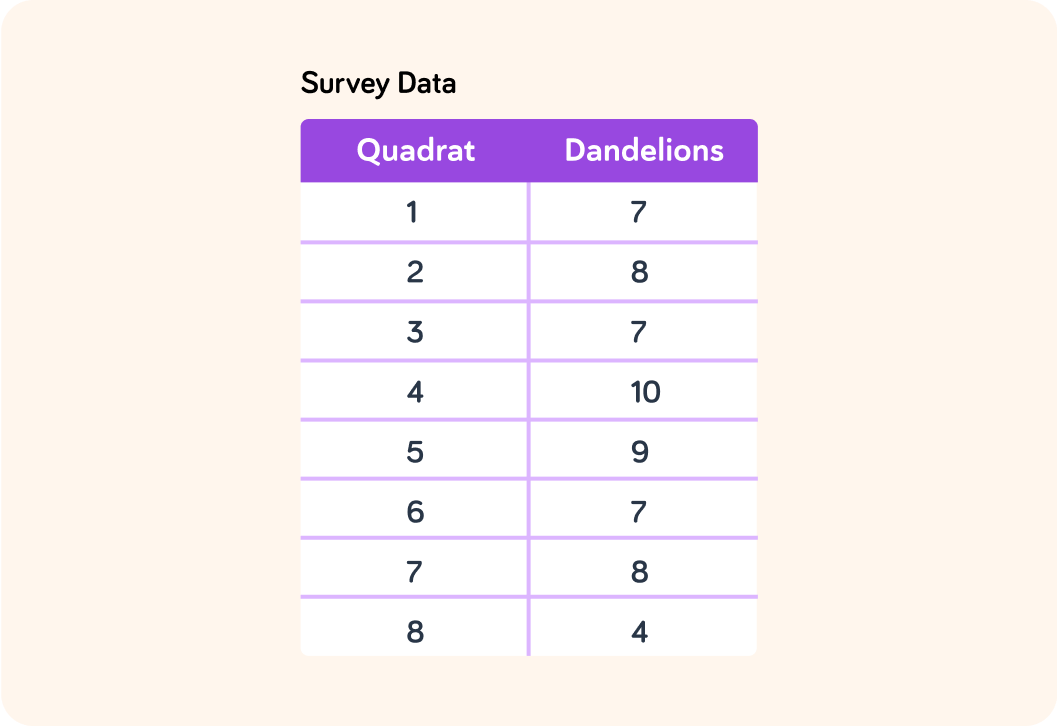
The mode value for this data is , so the mode value is...
A) the same as the mean or average. B) the middle value if the results are ordered by size. C) the number that occurs most often.
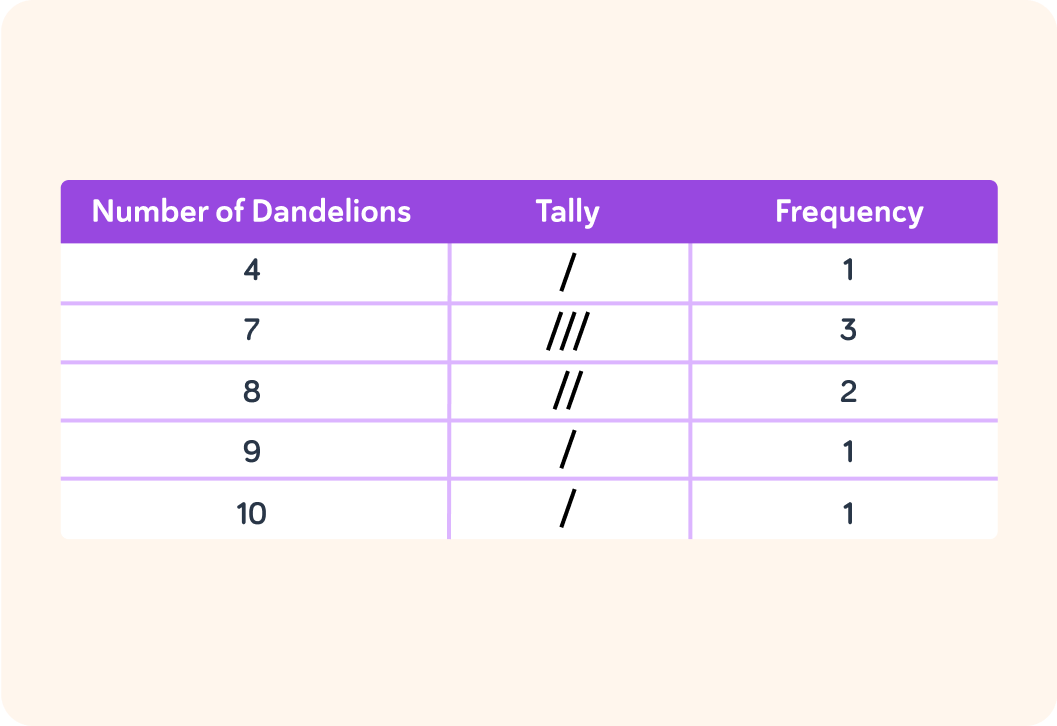
With a small set of data, it is easy to see which is the mode value, but if the data set was made up of hundreds or even thousands of readings this would be impossible!
We can use a frequency table to summarise the data and find the mode.
To find the median of this data, the first step is to put the numbers into numerical order.
- The median here is . What is the median?
A) The middle value of the sequence. B) Equal to the arithmetic mean. C) The most frequently occurring value in the set.
It is often useful to produce a graph over data. It allows us to see patterns more easily than looking at a lot of numbers. For example, we can create histograms (bar charts) or line charts. Which one should you use for displaying discontinuous data?
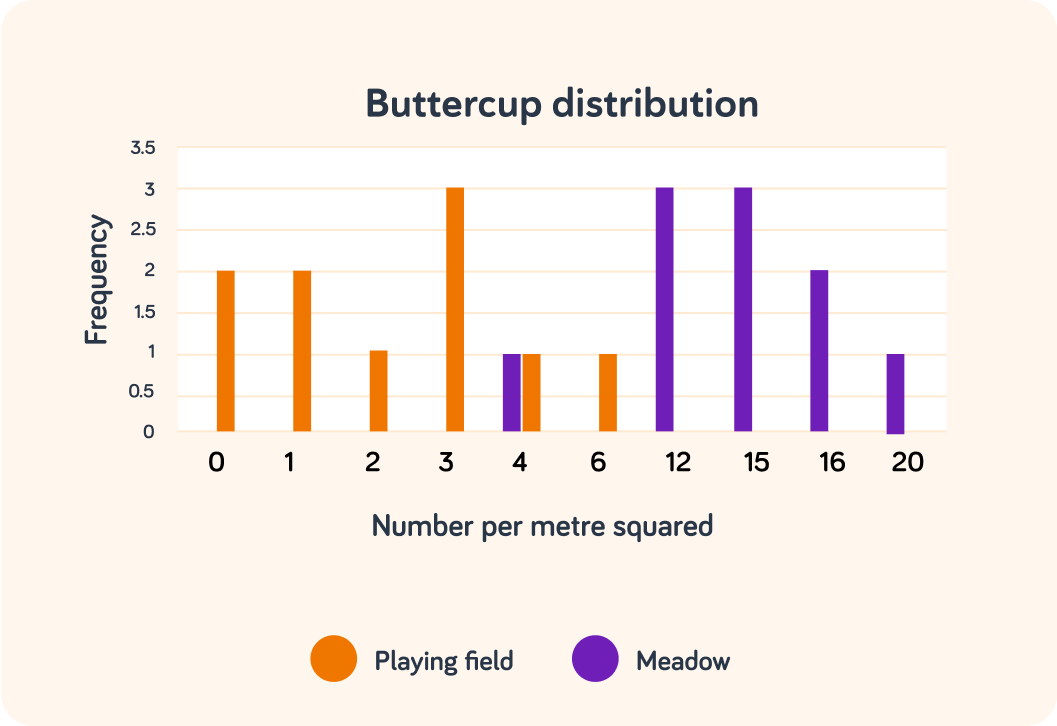
Look closely at the data in the table.
The data is discontinuous, meaning they are whole numbers that can be categorised. Because of this, it can be displayed in graph form as a histogram.
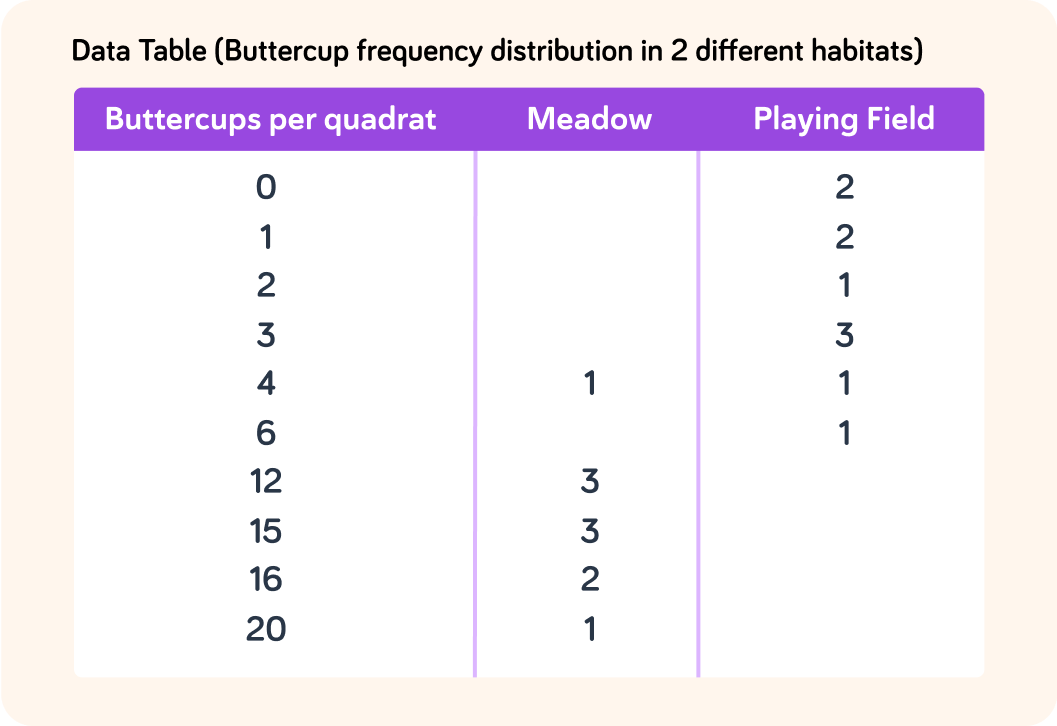
What is the mode value of buttercups in this playing field ecosystem?
Data taken along a belt transect is normally continuously changing data. What type of graph would you use for this sort of information?
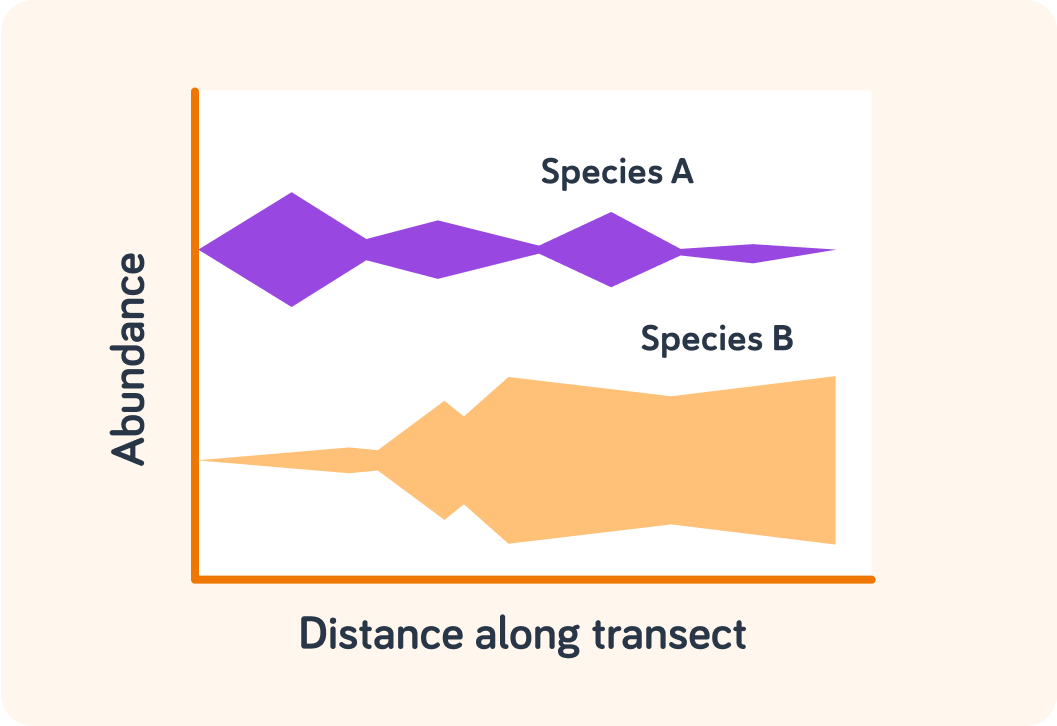
We can use a special sort of line graph to illustrate population distribution changes from one area to another across an ecosystem.
We call this a kite diagram.
What sampling technique would be most appropriate to obtain this data?
A) Pooter B) Quadrat only C) Belt transect
This data recorded the distribution of two species of seaweed A and B. The origin of the graph is the landward side of the shore.
Which species had a the highest abundance away from the landward side towards the sea, A or B?
Putting together your graphs
When you put together your graph, which axis should show the input variable data?
And which axis should show the outcome variable data?
What else should you check when you are putting together your graph?
You can select multiple answers