YOU ARE LEARNING:
Distance / Time Graphs

Distance / Time Graphs
You can read the speed of an object off a distance/time graph.
You find a snail crossing a path and want to figure out how fast it is going. To do this, what will you need?


You can select multiple answers
What are the two variables you will be measuring?

You can select multiple answers
After some time, you have taken a few measurements and filled out this table. Which of these is the independent variable?
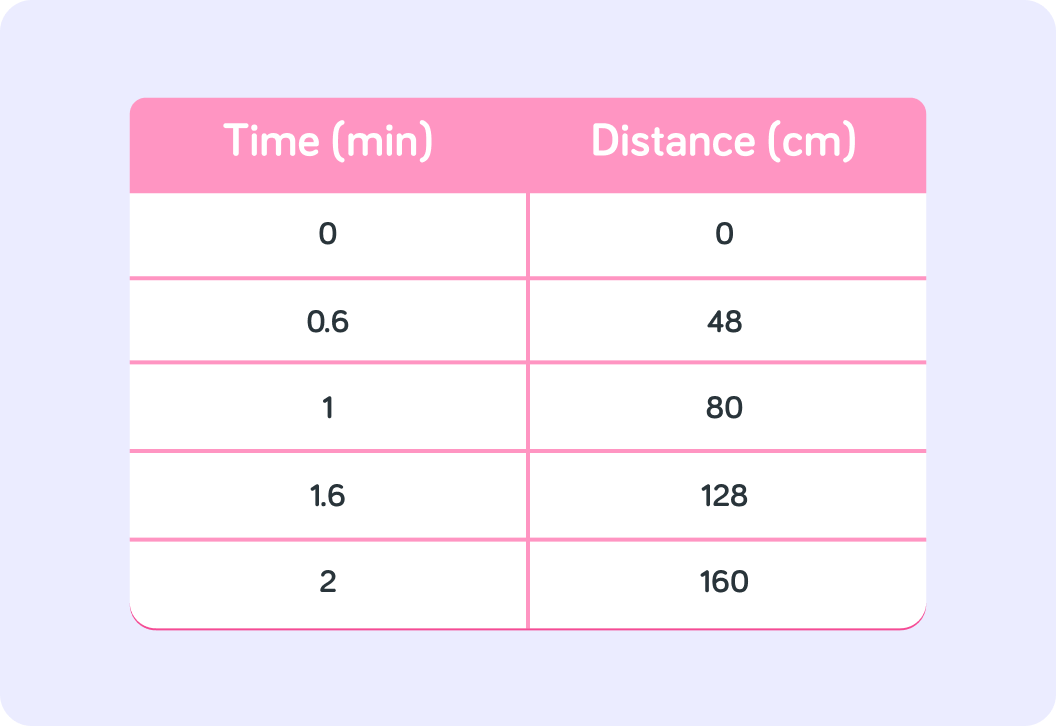
Here we can see your data points plotted on a graph!
It's called a Distance-Time graph because you've plotted distance (cm) against time (min).
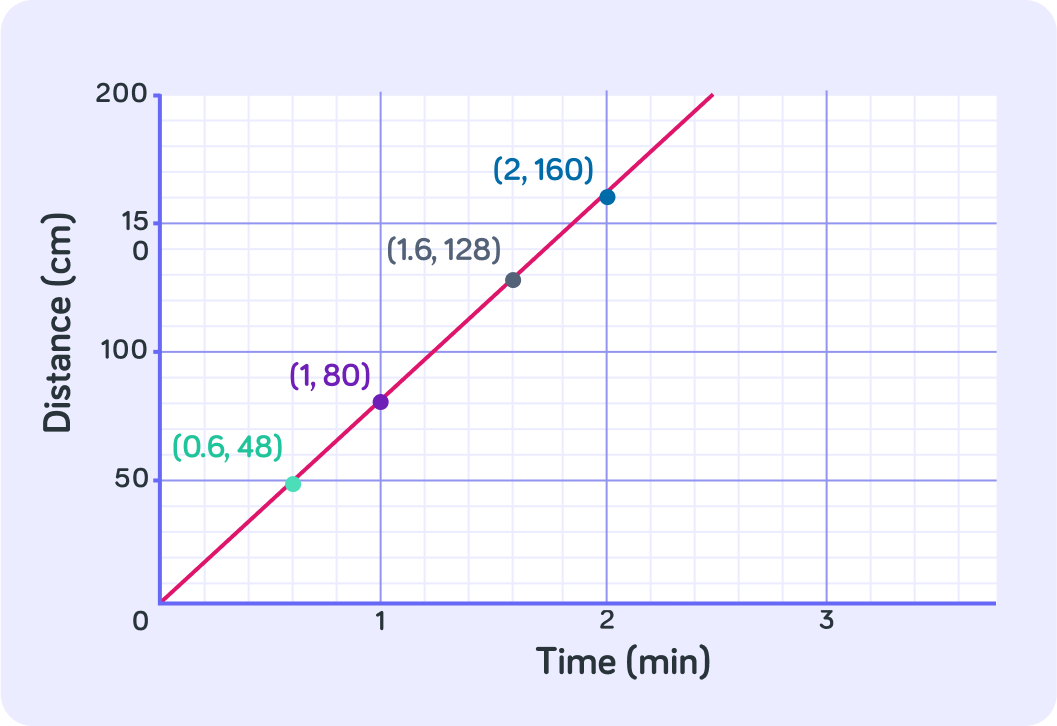
We know that . What is this the same as?
So the gradient of a D-T graph is the same as the speed! What is the speed in this graph constant? Answer yes or now
Great, so we know that the data you measured for the snail crossing the path shows that it had a constant speed. What was the snail's speed in ?
This was a lot of information to take in!
So now let's break it down.
This is a distance/time graph
It shows us the position of an object at certain points in time.
What do you read on the y-axis? This is the dependent variable.
What do you read on the x-axis? This is the independent variable.
Every graph has a dependent variable (along the y-axis)
The dependent variable, in this case distance or position, is what is measured in a scientific experiment.
And every graph also has an independent variable (along the x-axis) .
The independent variable, in this case time, is changed or controlled in a scientific experiment to test the effects on the dependent variable.
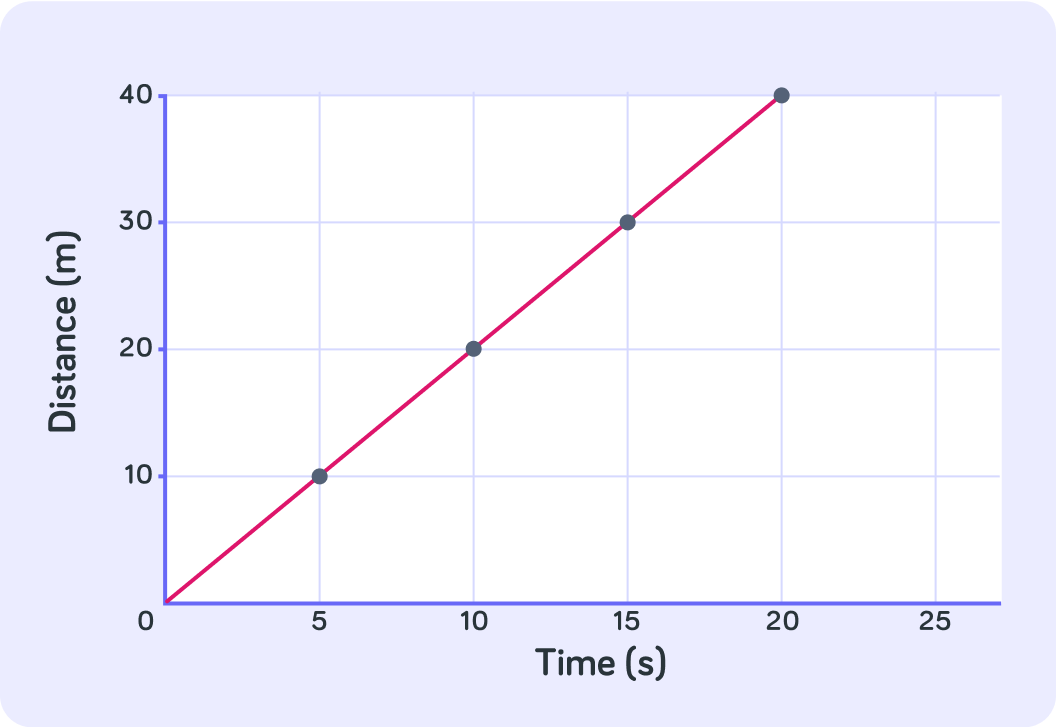
Let's try reading this graph.
How far had this object moved after 5 seconds?
At time = 5 seconds, the object had moved 10m.
This is shown in the point .
How far had this object moved after 15 seconds?
So in 15 seconds the object moved 30 metres. How fast was this object going in metres per second?
True or false? The object was moving at the same speed on the whole journey.
Now, which one of these lines show the fastest moving object?
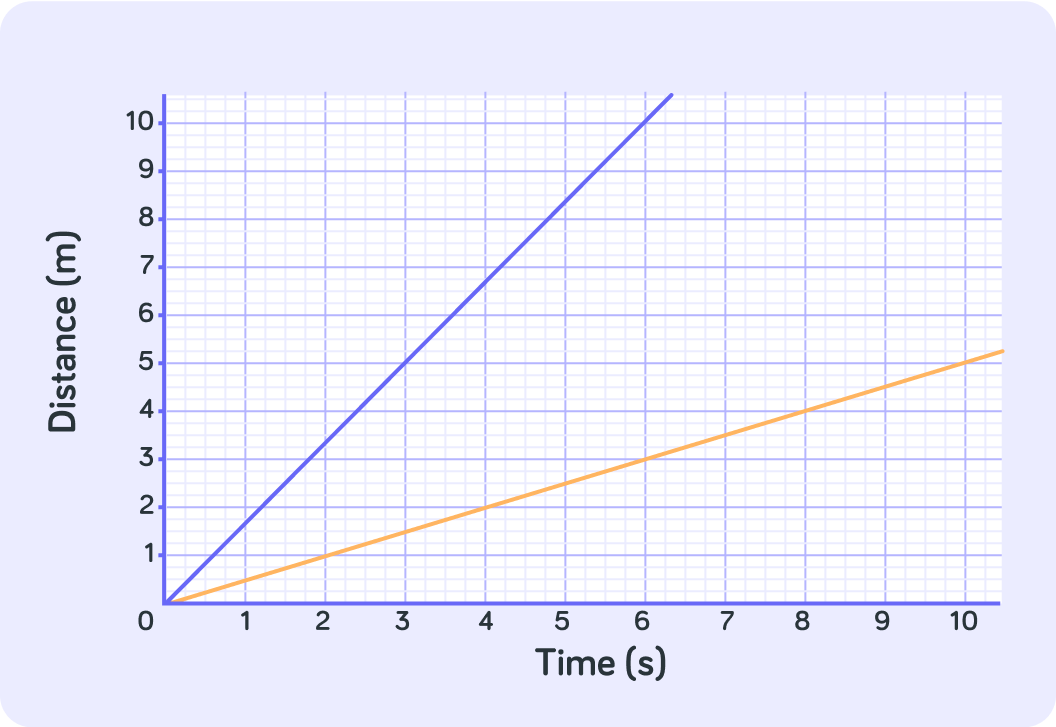
For a distance/time graph, the steeper the line, the faster the object is moving
The blue line shows an object that moved 1.5 metres every second, whereas the orange line shows an object that moved only 0.5 metres every second.
Calculating the gradient of a straight line
The speed of an object in a distance/time graph is the same as the graph's gradient
To find out what the gradient is, we pick two points on the graph that are easy to read.
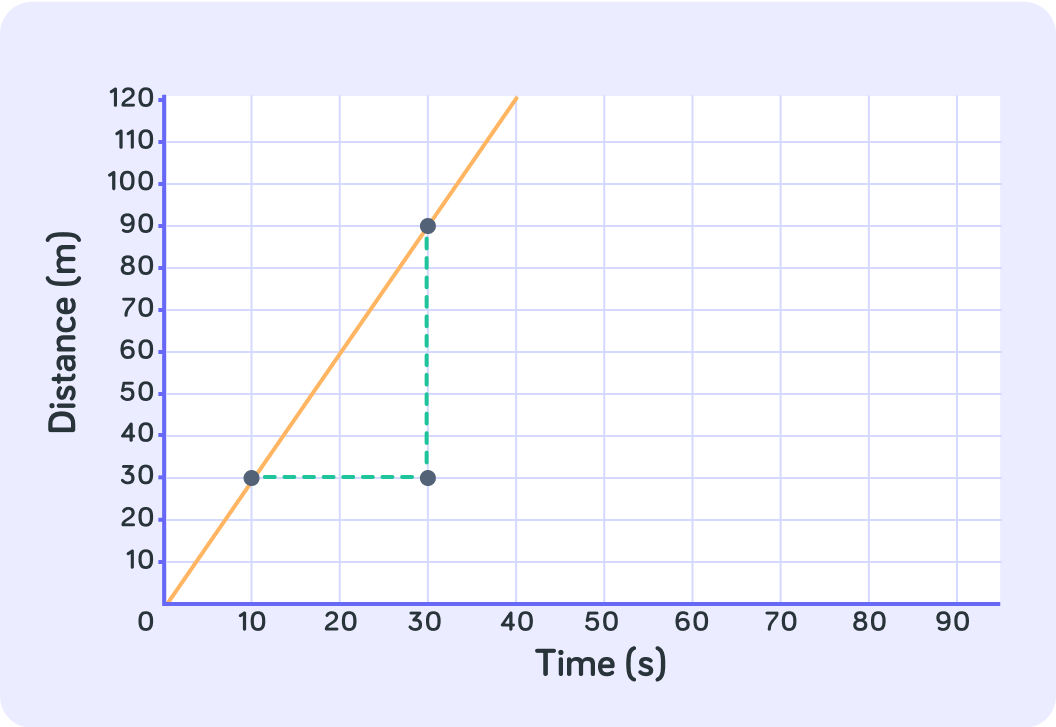
Here we picked the two points and . What is the difference between the x-coordinates?
What is the difference between the y-coordinates for the two points and ?
So if 20 steps along x-axis takes you 60 steps up on the y-axis, what is gradient of this line? In other words, for every second, how many metres has the object travelled?
So the gradient of this line is 3
Every time you go 1 out on the x-axis, you go 3 up on the y-axis.
Which one is the right formula for calculating the gradient?
So the gradient and the speed is the same in a distance/time graph
We can calculate the gradient using this formula:
For example: This object is moving at
When calculating the gradient it is important to remember we're measuring the change in y and the change in x*.*
This is the same as saying the distance travelled from one point to another, and the time taken to travel that distance.
What is the gradient here?
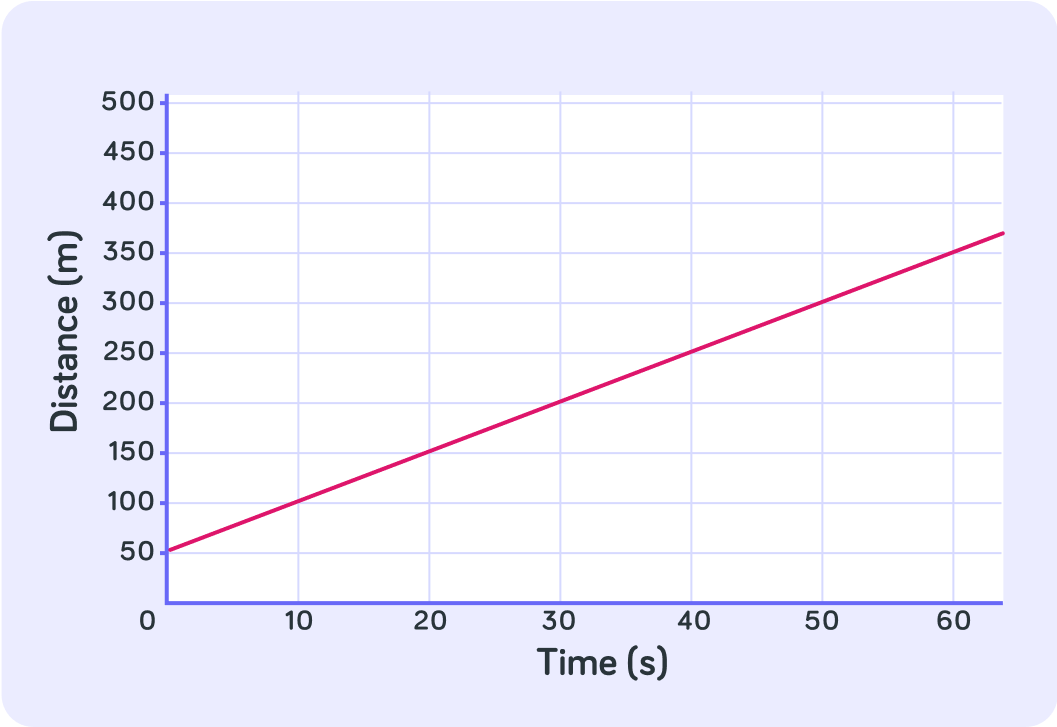
What is the speed of this object?
Horizontal Lines
True or false? Every second, this object moves 1 metre.
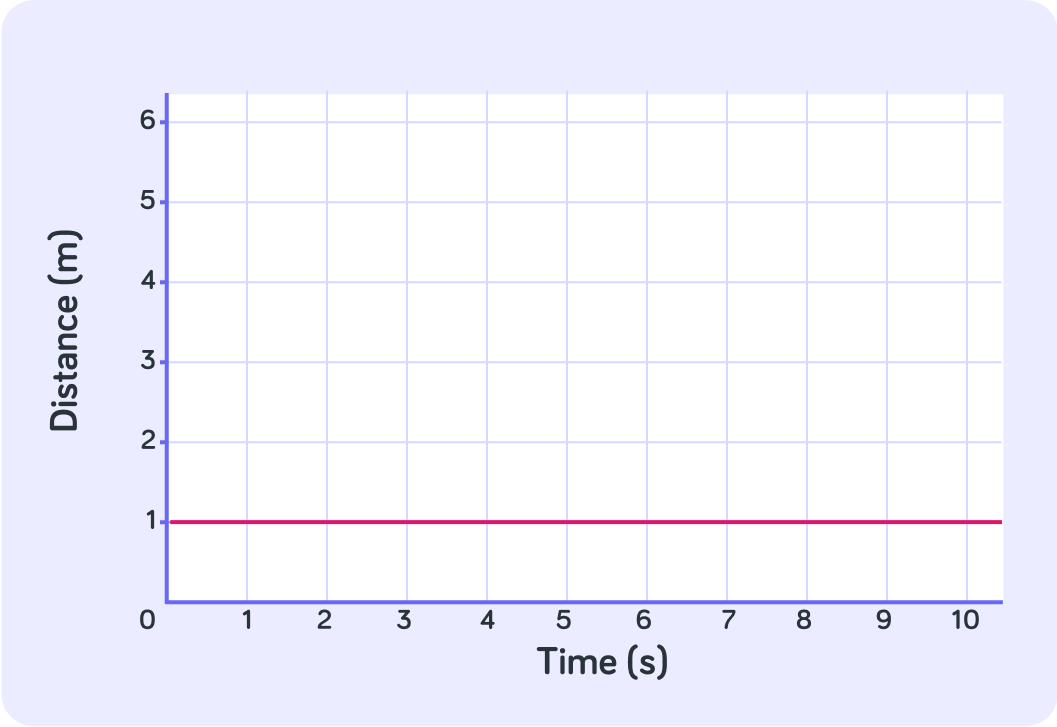
So what is this object doing?
A horizontal line on a distance/time graph means the object isn't moving
No matter how much time goes by, this object is not increasing its distance, so the object is stationary.
Negative Gradients
What is the gradient of this line?
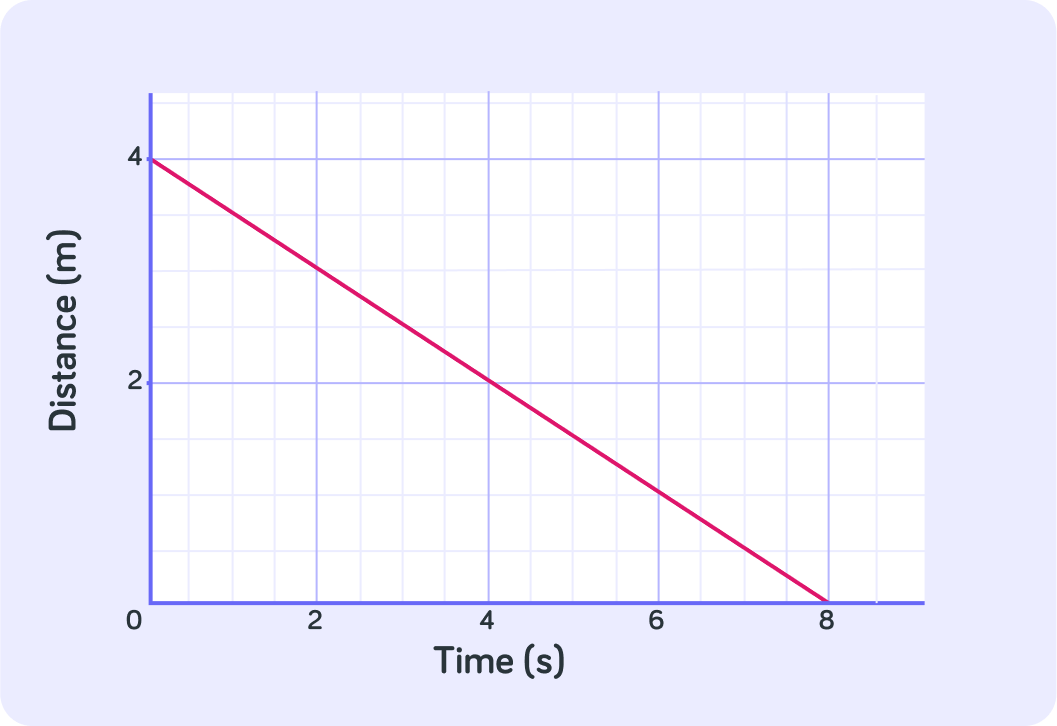
What is the speed shown in this graph?
What is the velocity shown in the graph?
Until now, the speed and velocity given in the graphs has been the same.
When there is a negative gradient, it shows a negative velocity. The speed simply describes the size of this velocity.
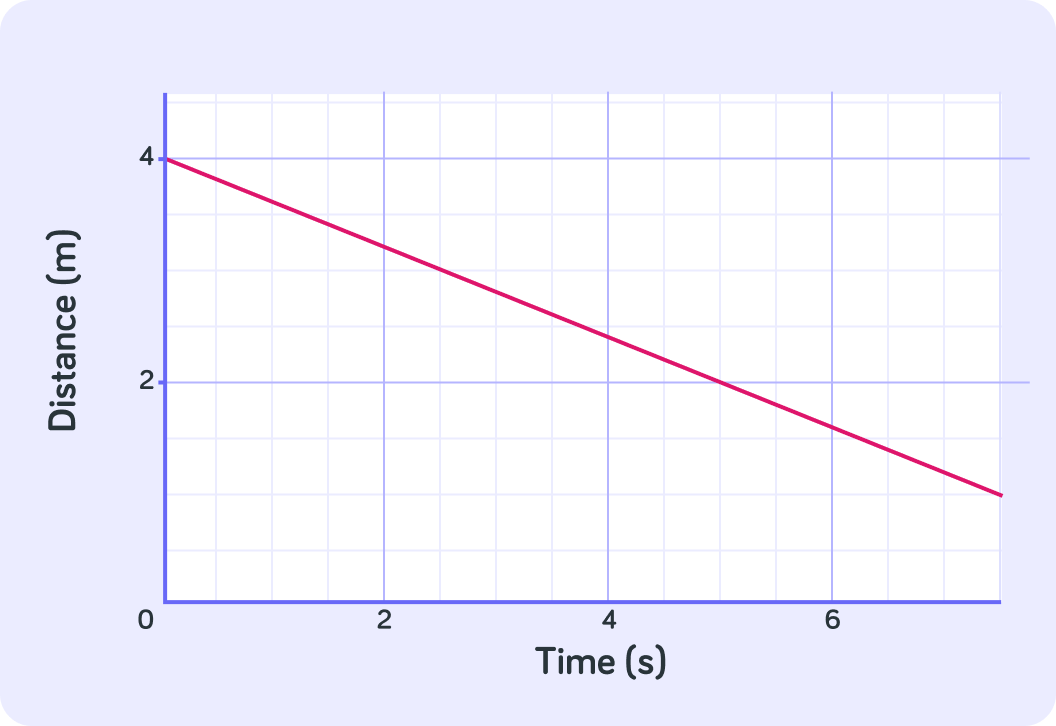
What does a negative velocity mean?
So a negative velocity describes an object moving backwards towards its starting point.
It does this at a speed equal to the magnitude of the gradient.
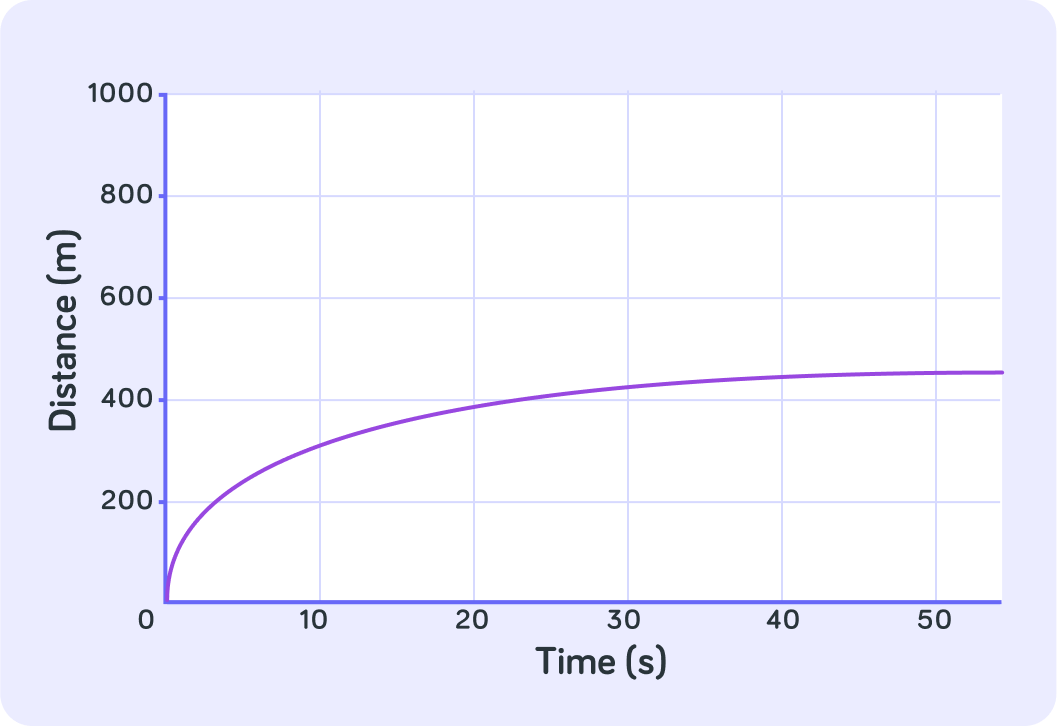
Curved Lines
Did this object keep a constant speed throughout its journey? Answer yes or no.
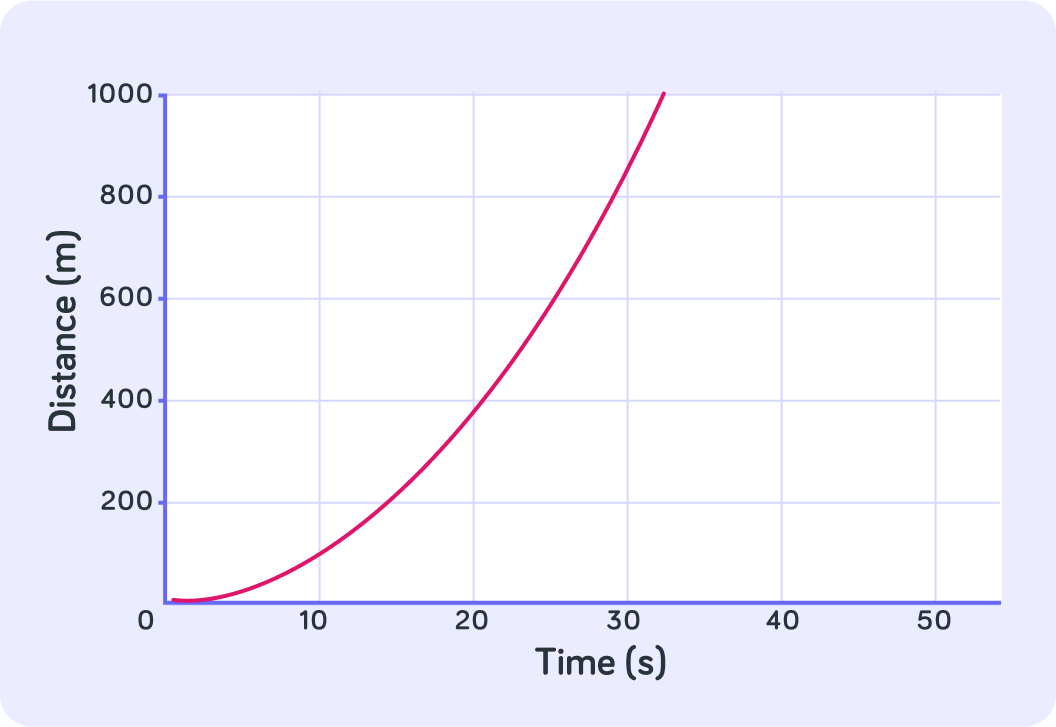
What was the object doing?
What about the object shown by the purple line? What was that object doing?
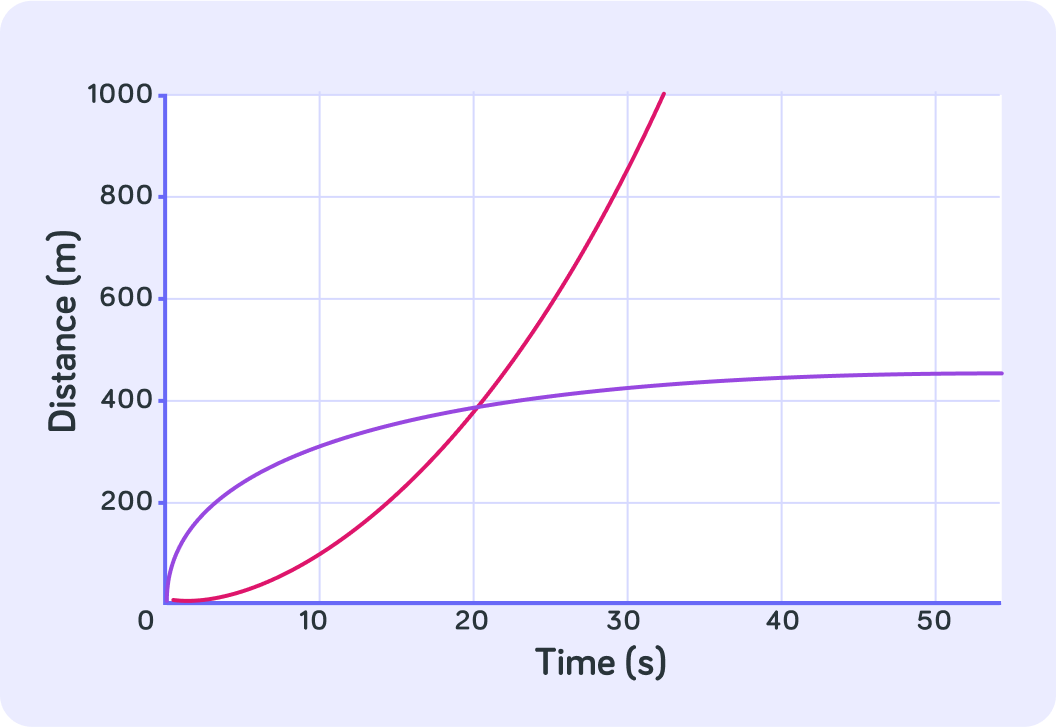
The purple line shows an object that is slowing down
As time goes by, the curve becomes flatter and flatter and flatter. Eventually it might actually flatten out entirely and the object would be stationary.
If an object is travelling at constant speed the line in a distance/time graph will be ________
If an object is changing speed, the line on a distance/time graph will be _______
Summary!
The gradient in a distance/time graph is the same as the speed
We can calculate the gradient between two points like this:
A straight line means the object is moving at a constant speed
The gradient of the line does not change, so neither does the speed.
A horizontal line means the object is stationary
The gradient, and speed, will be zero no matter where you calculate it.
A negative gradient shows a negative velocity.
This describes an object moving backwards (towards its starting point).
A line that curves upwards means the object is speeding up
The gradient will be bigger and bigger the further along the x-axis you measure it.
A curve that flattens out means the object is slowing down.
The gradient is smaller and smaller the further along the x-axis you measure it, until you reach 0 (a horizontal line).