YOU ARE LEARNING:
Straight Line Graphs 1

Straight Line Graphs 1
Straight lines are the simplest functions to represent on a graph, as they involve equations where the highest power of x is 1.
We can plot a straight line graph by finding two points and drawing the line through them.
The equation of a line helps us find values for the and coordinates.
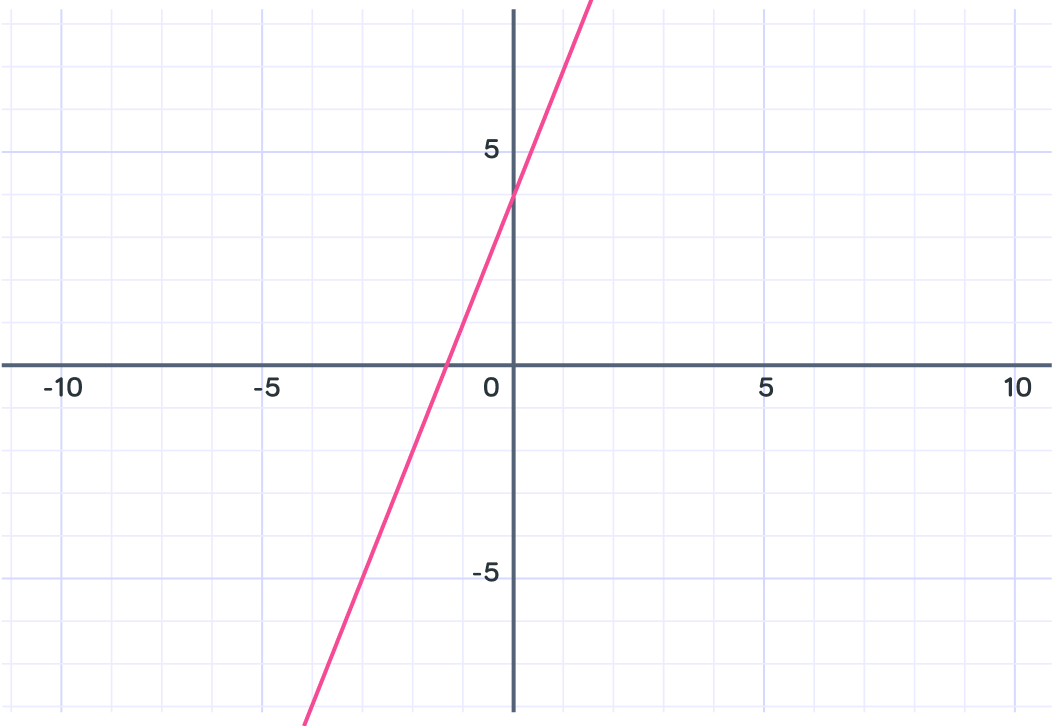
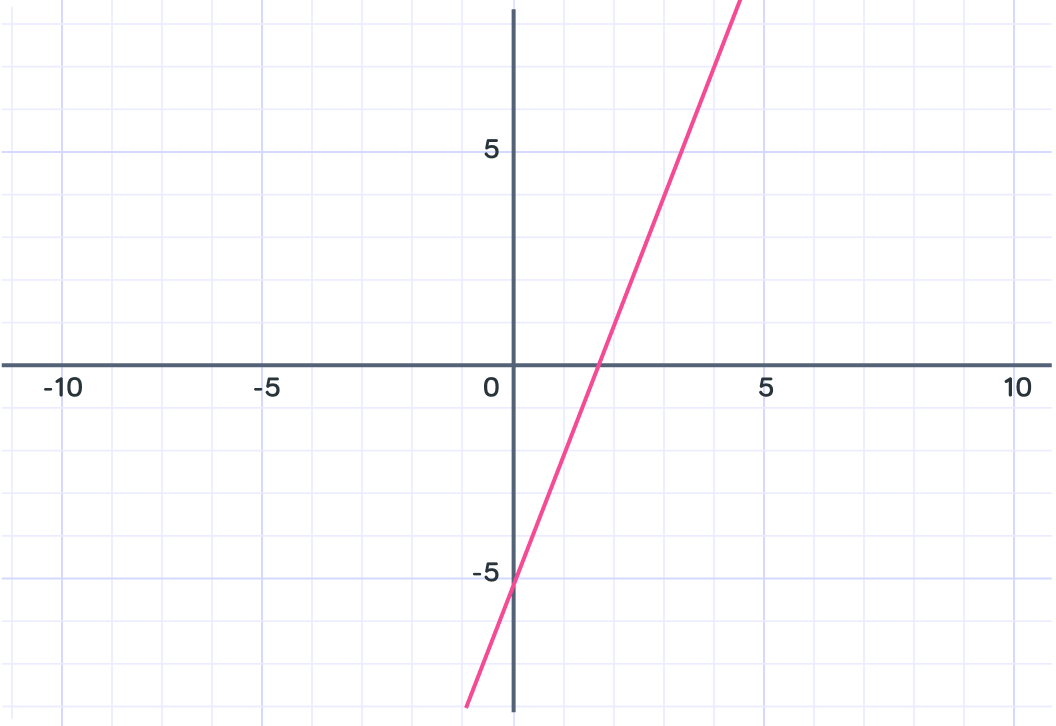
Let's draw the line for .
The easiest point to find is when so what is the coordinate when ?

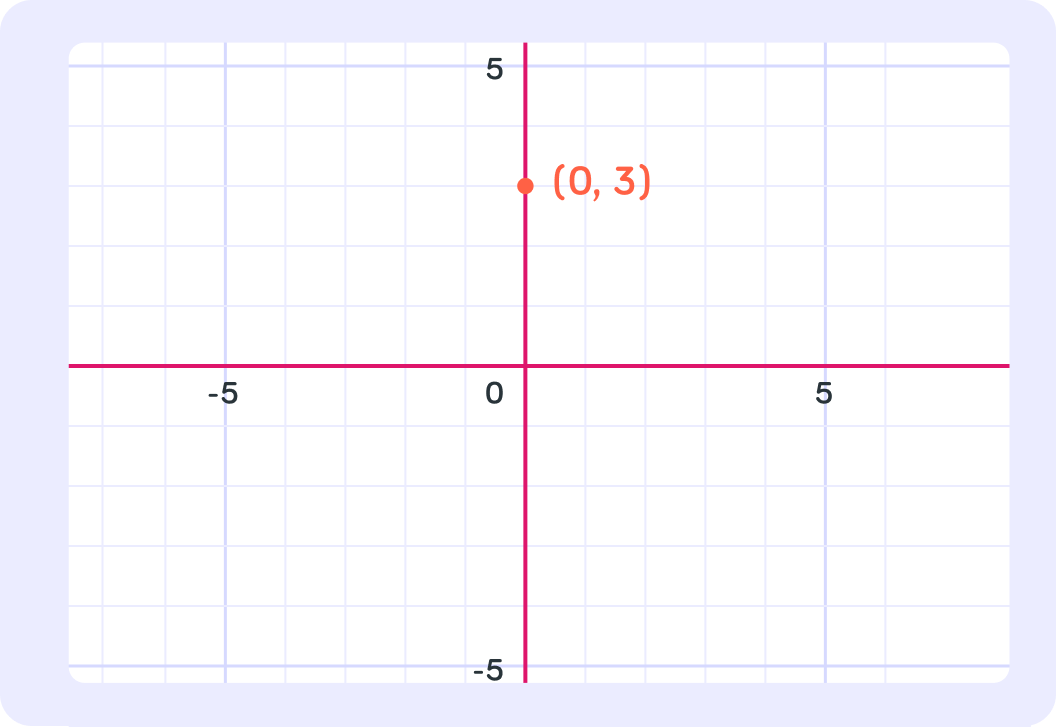
The first point we have found is .
This is plotted on the graph here.
Let's plot a second point for the line . What is the coordinate for this point when ?
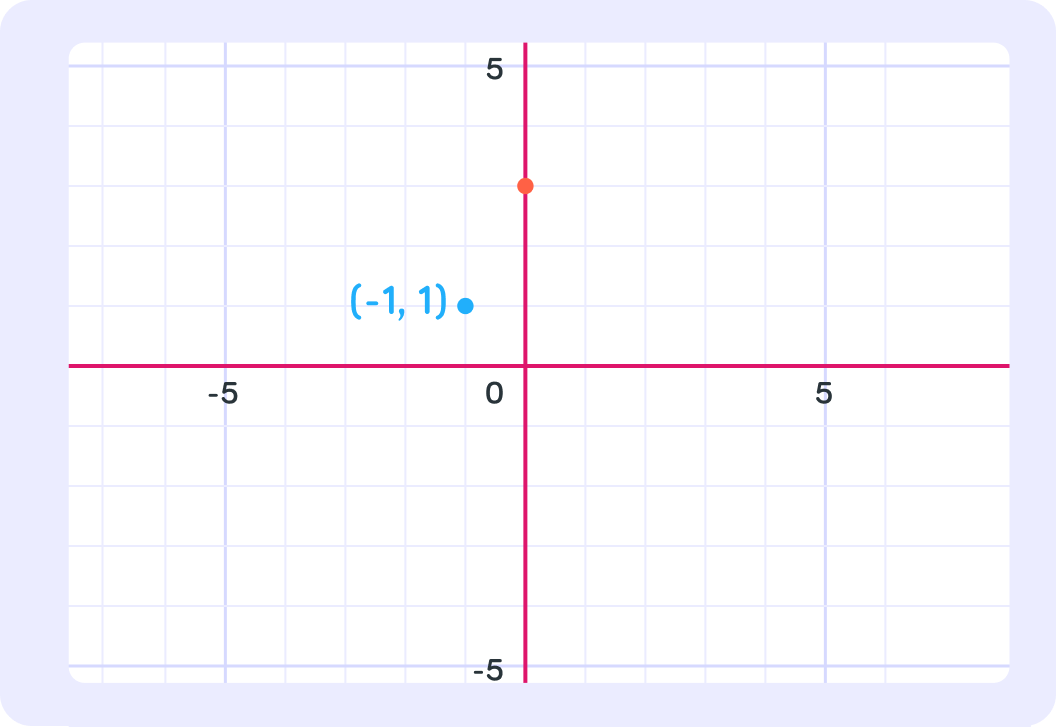
The second point we have found is .
This is plotted on the same graph as .
Now we join the two points and extend the line either side of them.
We have drawn the line with equation

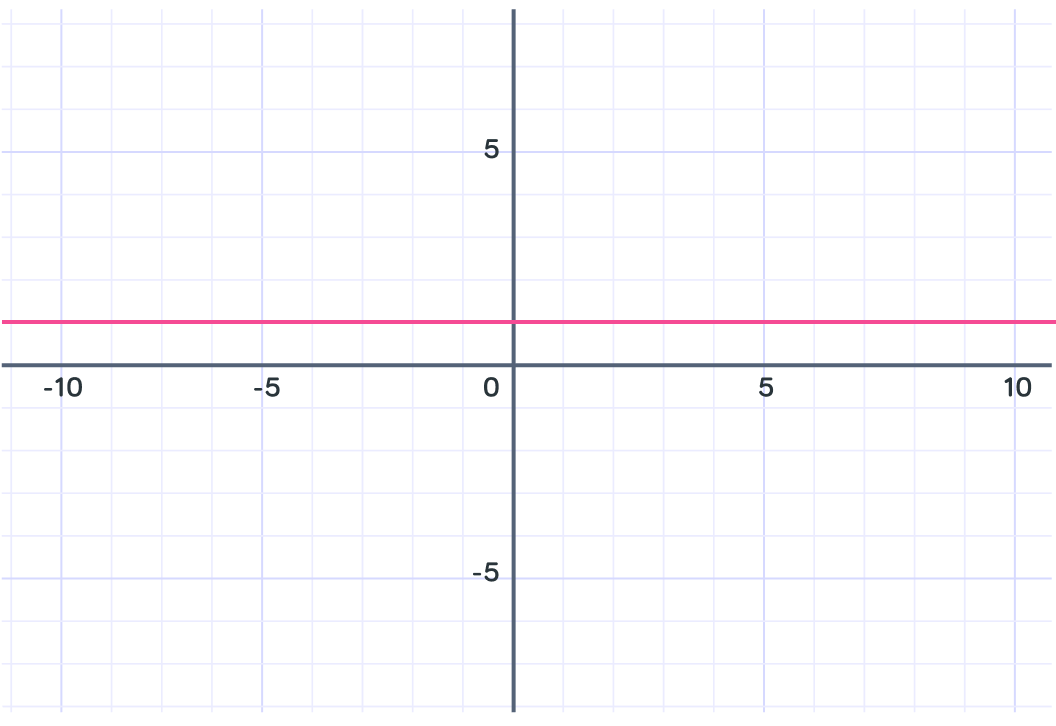
The simplest line equations are vertical or horizontal lines.
Let's look at vertical lines first.
We seen that a vertical line has an equation of the form . This line is horizontal, what do you think the equation of this line is?
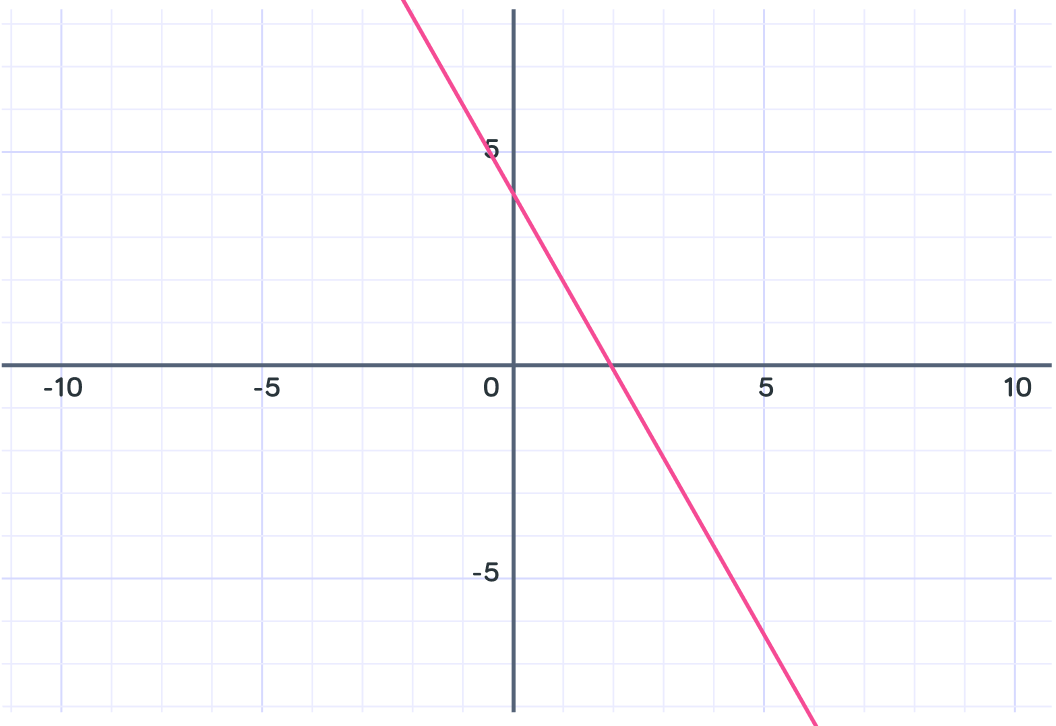
An important point on a straight line graph is the intercept.
This is where the line crosses the axis. When writing the intercept we only write the coordinate.
Looking at the graph, what is the intercept for this straight line?

What is the coordinate at the intercept?
What is the intercept on the graph of shown here?
This is the graph of . What is the intercept of this straight line graph?

Summary! To plot a straight line graph, we need two points.
We can find more points, but we only need two.
This is the line with equation .
We can find two point - first when we find that , when we find that and the two points we need are and .

A vertical line always has the equation where is any number.
This is the graph of .
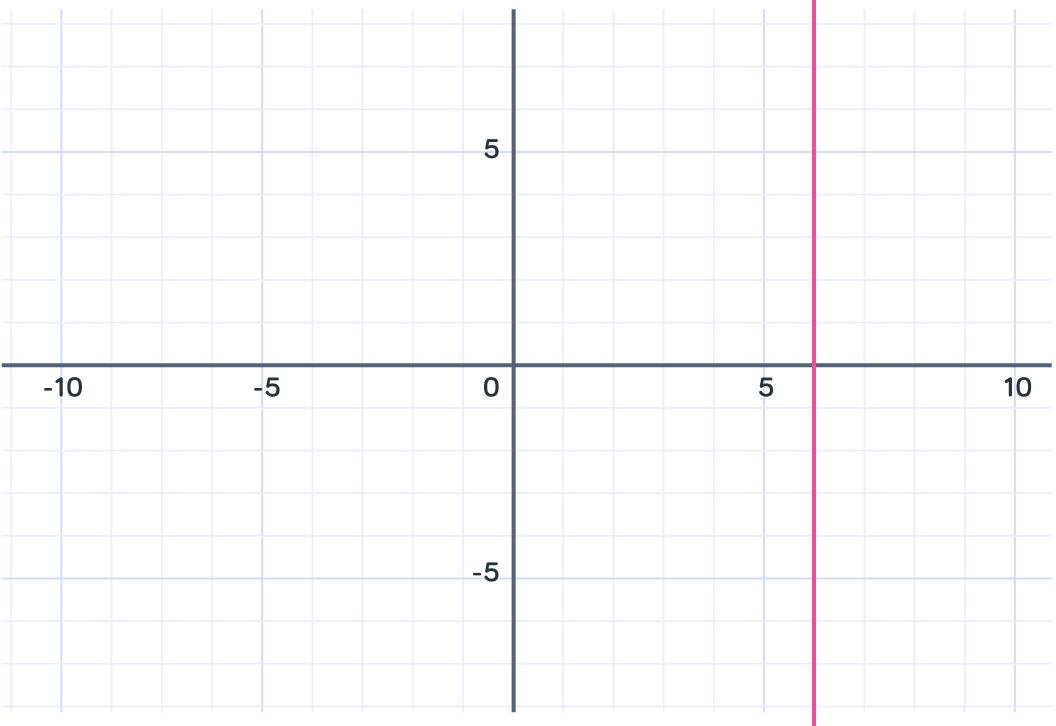
A vertical line always has the equation where is any number.
This is the graph of .

The intercept is the coordinate where the graph crosses the axis, that is when .
Here the intercept is .