YOU ARE LEARNING:
Probability and Frequency Trees

Probability and Frequency Trees
Probability Frequency Trees display frequencies on the branches, which we can use to find probabilities.
Frequency tree diagrams are similar to probability tree diagrams. However, they record frequencies on the branches instead of probabilities.
Recording frequencies on a tree diagram gives us absolute information about how many of something there are, and also enables us to calculate probabilities.
A frequency tree diagram looks like this
The branches are labelled with the category, and the circle at the end holds the frequency (amount) for that category.
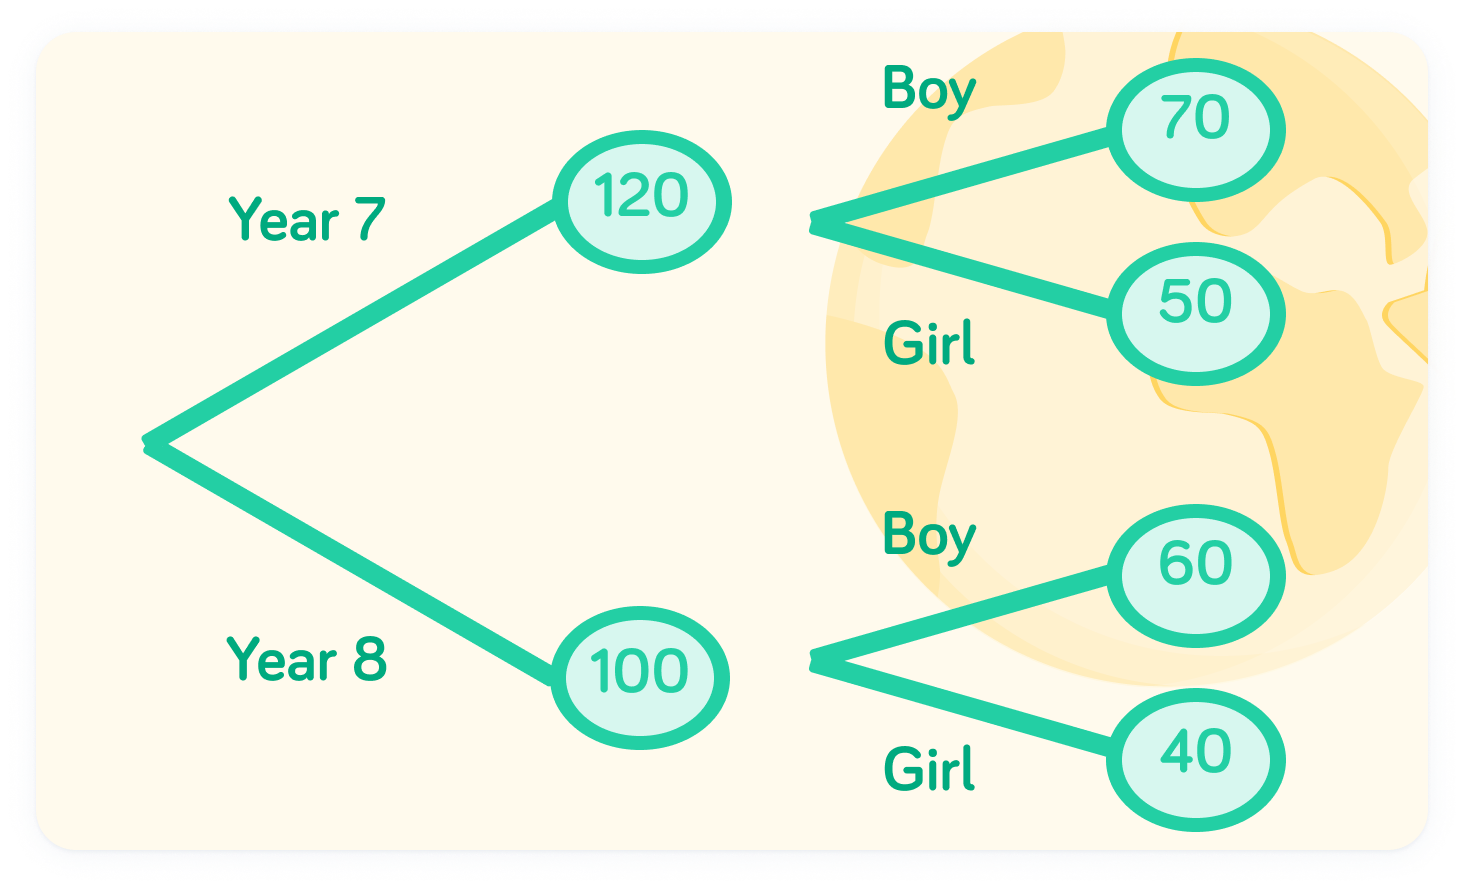
The branches on the left affect the frequency on the right
Notice that the frequencies labelled on the branches on the right add up to the frequency for the category on the left. For example, the number of girls (50) and boys (70) in year 7 adds up to the total in year 7 (120)
How many boys are in Year 8?

How many girls are there across both year groups?
We can also find probabilities from frequency trees
Since we have information about the proportion of boys and girls in the two years, we can find out probabilities relating to them.
Let's find the probability of a student being a boy in Year 8
If a student is picked at at random, what is the probability they are a Y8 boy? We can see that there are boys in Year 8, and students in total.
Give in its simplest form.
can be simplified to
Therefore, the probability of a random student being a boy in Year 8 is P(Y8 Boy)=.