YOU ARE LEARNING:
Sets and Venn Diagrams
Sets and Venn Diagrams
Venn diagrams are a tool for visualising crossover between two groups.
Set notation allows us to easily list members of a collection of numbers or objects, but we can also represent sets visually using venn diagrams.
100 is a member of set M.
M = {positive multiples of 10 under 1000}
How would you notate this?

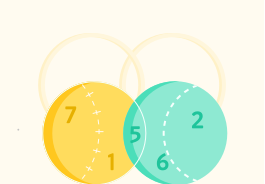
A venn diagram uses circles to represent sets
The diagram creates a region in the middle for values which overlap between two sets.
Let universal =
A = {even numbers} and B = {square numbers}
We can assign values to each set from the universal
can be . Members of A (even numbers) can be . Members of B (square numbers) can be .
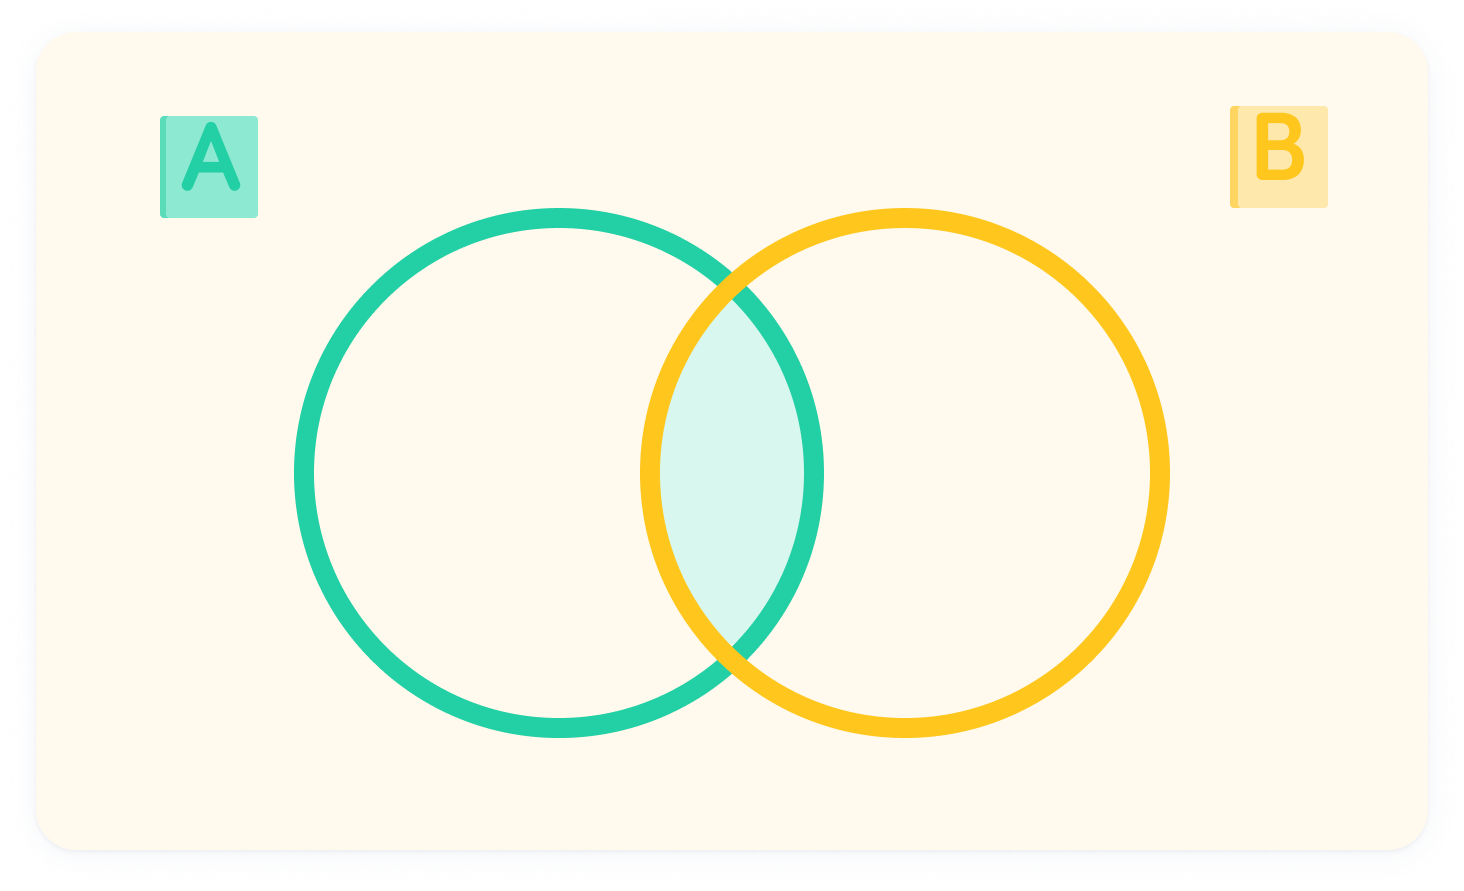
Each circle represents a set
We can place values in locations on the diagram depending on their relation to the sets. Numbers that do not belong to either set are placed on the outside.
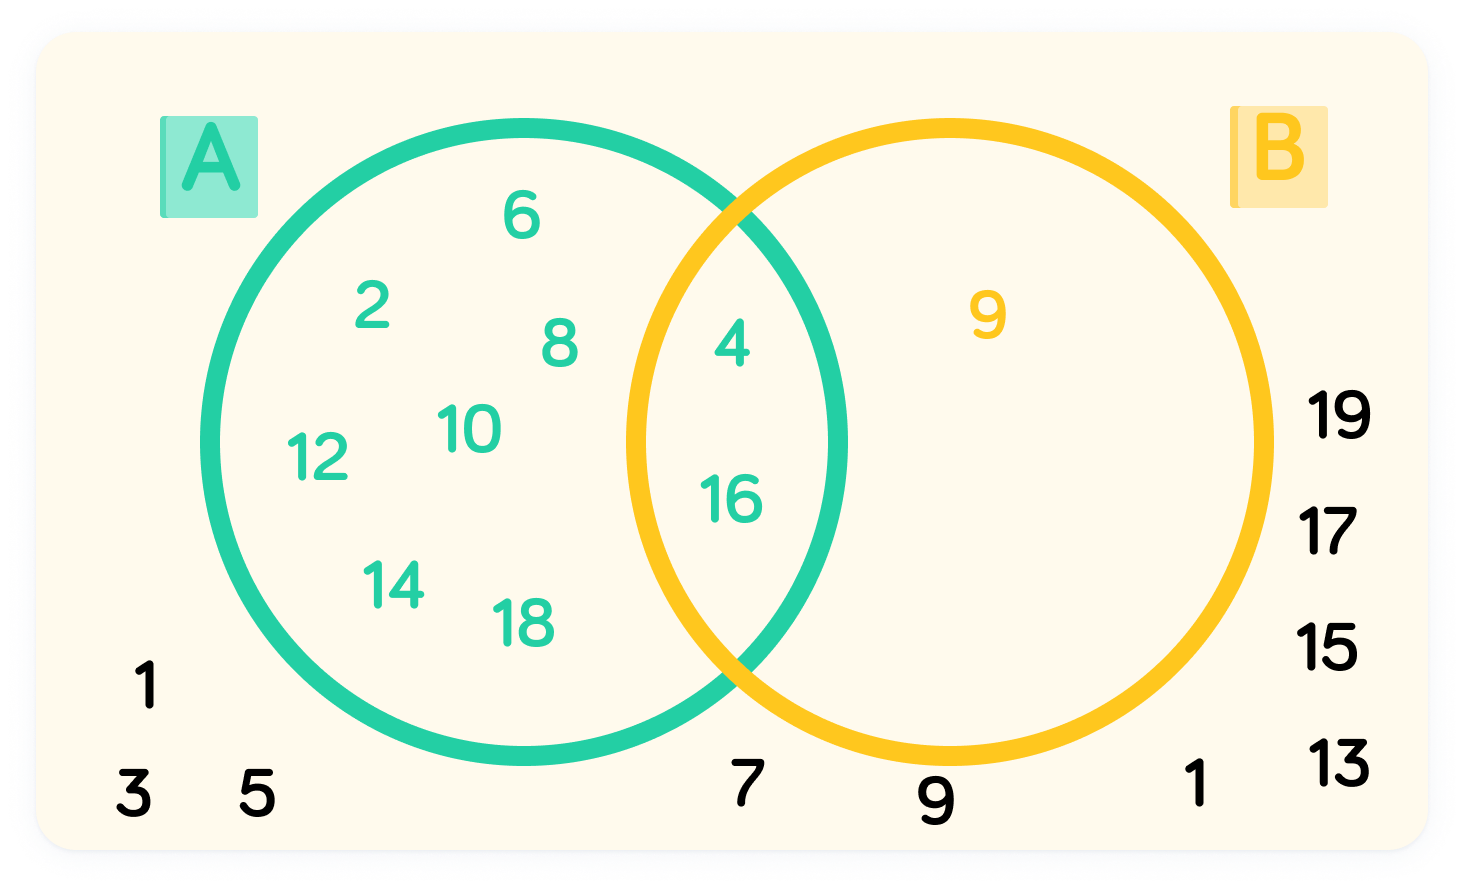
Numbers in the middle fit both sets
This is the intersection and can be written as A ∩ B. In this example, A ∩ B = {4,16}
Elements in either set are called the union
These can be written as A ∪ B. In this example, A ∪ B = {2, 4, 6, 8, 9, 10, 12, 14, 16, 18}
Elements that are not in set A can be notated as A'
In this case . Similarly, values not in set B can be notated as B'.