YOU ARE LEARNING:
Venn Diagrams and Probability
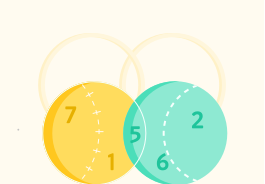
Venn Diagrams and Probability
Venn diagrams are an efficient way to show frequency, and can be used to solve probability problems.
A Venn Diagram is a useful way to display frequency and sets visually. They can also be useful in solving probability problems when we are missing some information.
A survey asked 20 people if they owned a dog or a cat
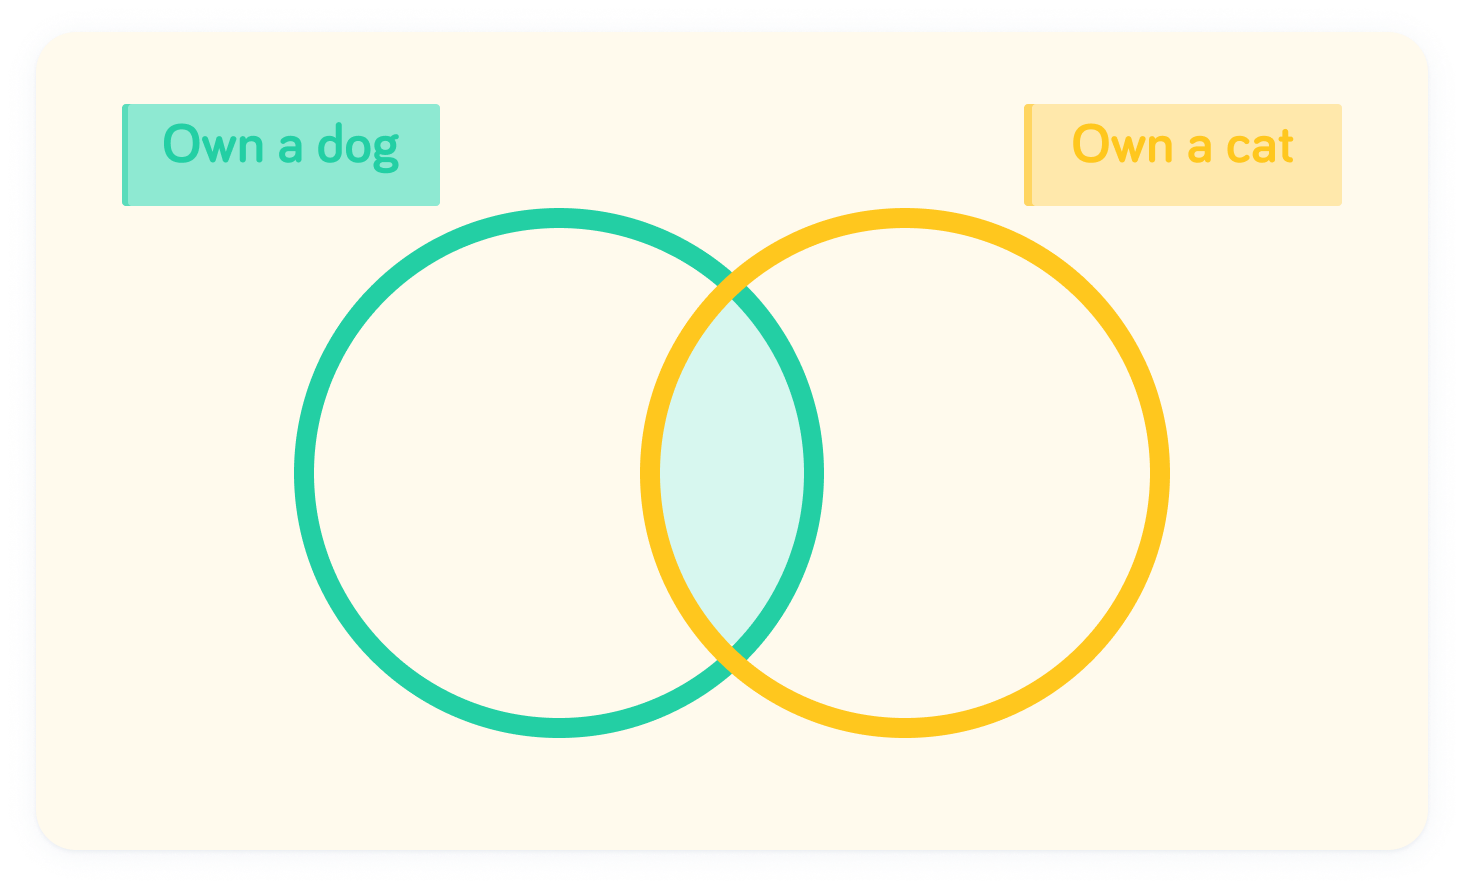
3 people said they owned neither a dog nor a cat. 6 people said they owned both a dog and a cat. And 7 people said they owned only a dog.
Fill in the values we know
3 people didn't own either a dog or a cat - this will go on the outside. 6 people own both a dog and a cat, so this will be in the intersection. 7 people own only a dog, so this will be in the left hand circle outside of the intersection.
Let's find the number of people who own a cat
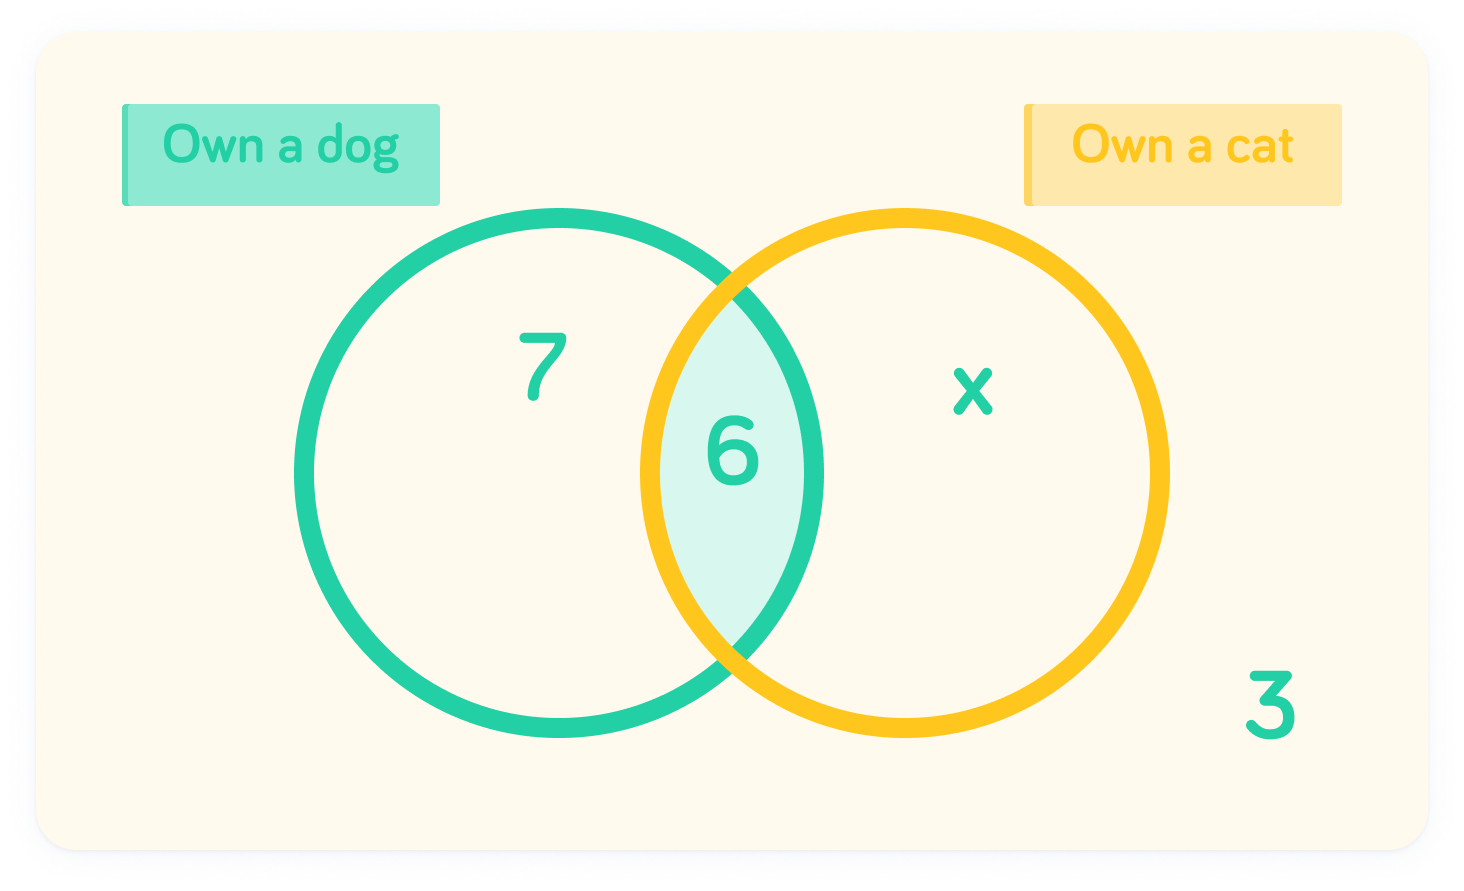
We can form an equation involving x, where the universal is 20. Therefore, x+6+7+3=20

If x+6+7+3=20, what is x?


x=4
By subtracting 16 from both sides, we find that x=20−16, so x=4. So, there were 4 people who only owned a cat.

In a survey which asks whether people play golf (set G) or football (set F), there are 8 people who play both sports. How would you notate these people who play both?

Let's look at another example which involves finding the probability of finding values in sets.
A survey asked 20 people if they owned a dog or a cat
3 people said they owned neither a dog nor a cat. 6 people said they owned both a dog and a cat. 10 people said they owned a dog. We can fill these values in on the diagram.
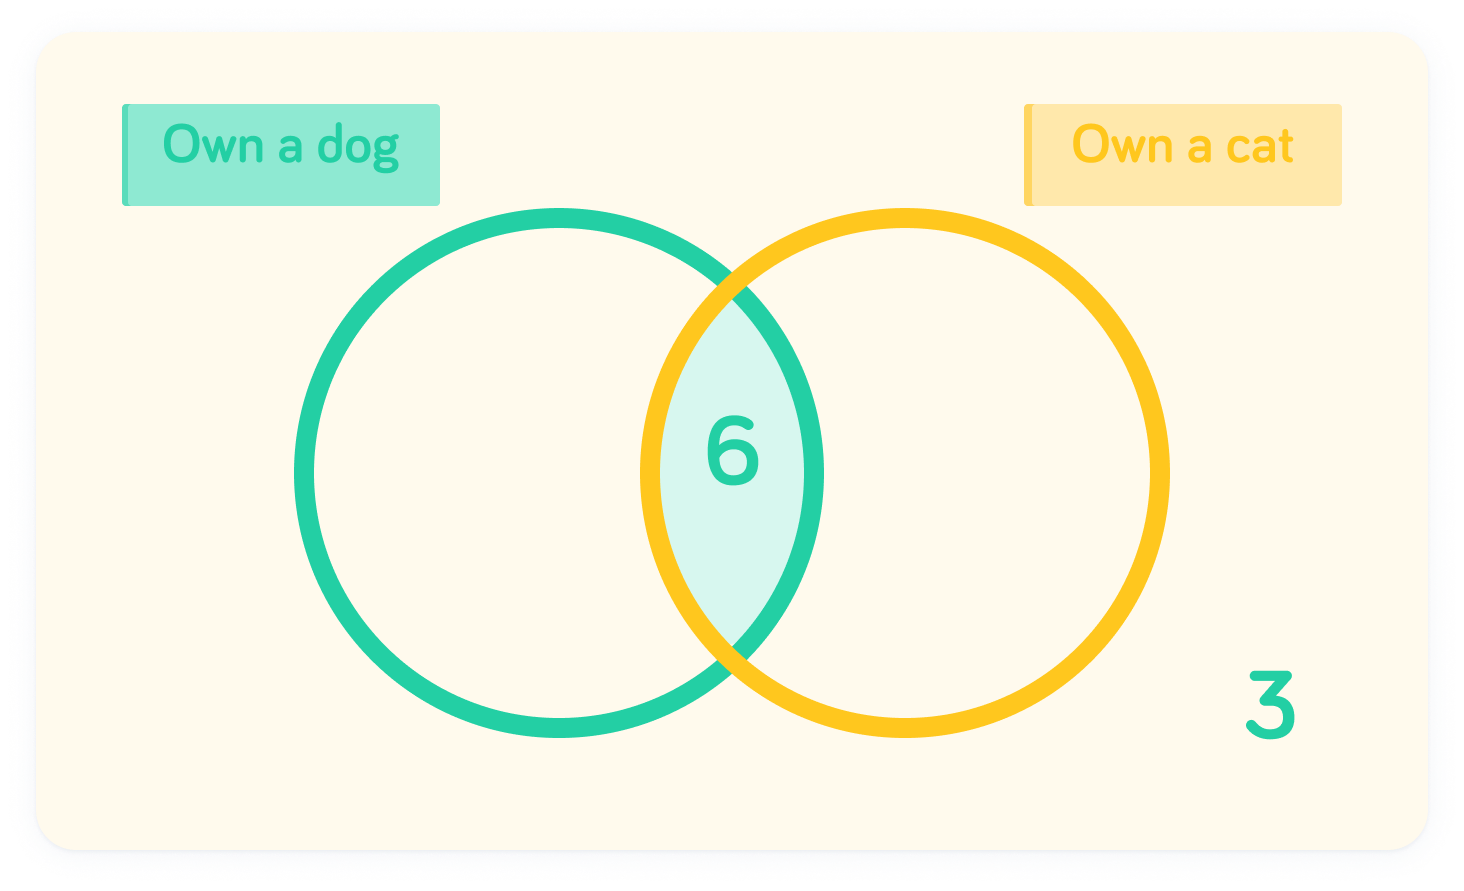
In total, 10 people own a dog
We can use this to find the amount of people who only own a dog.
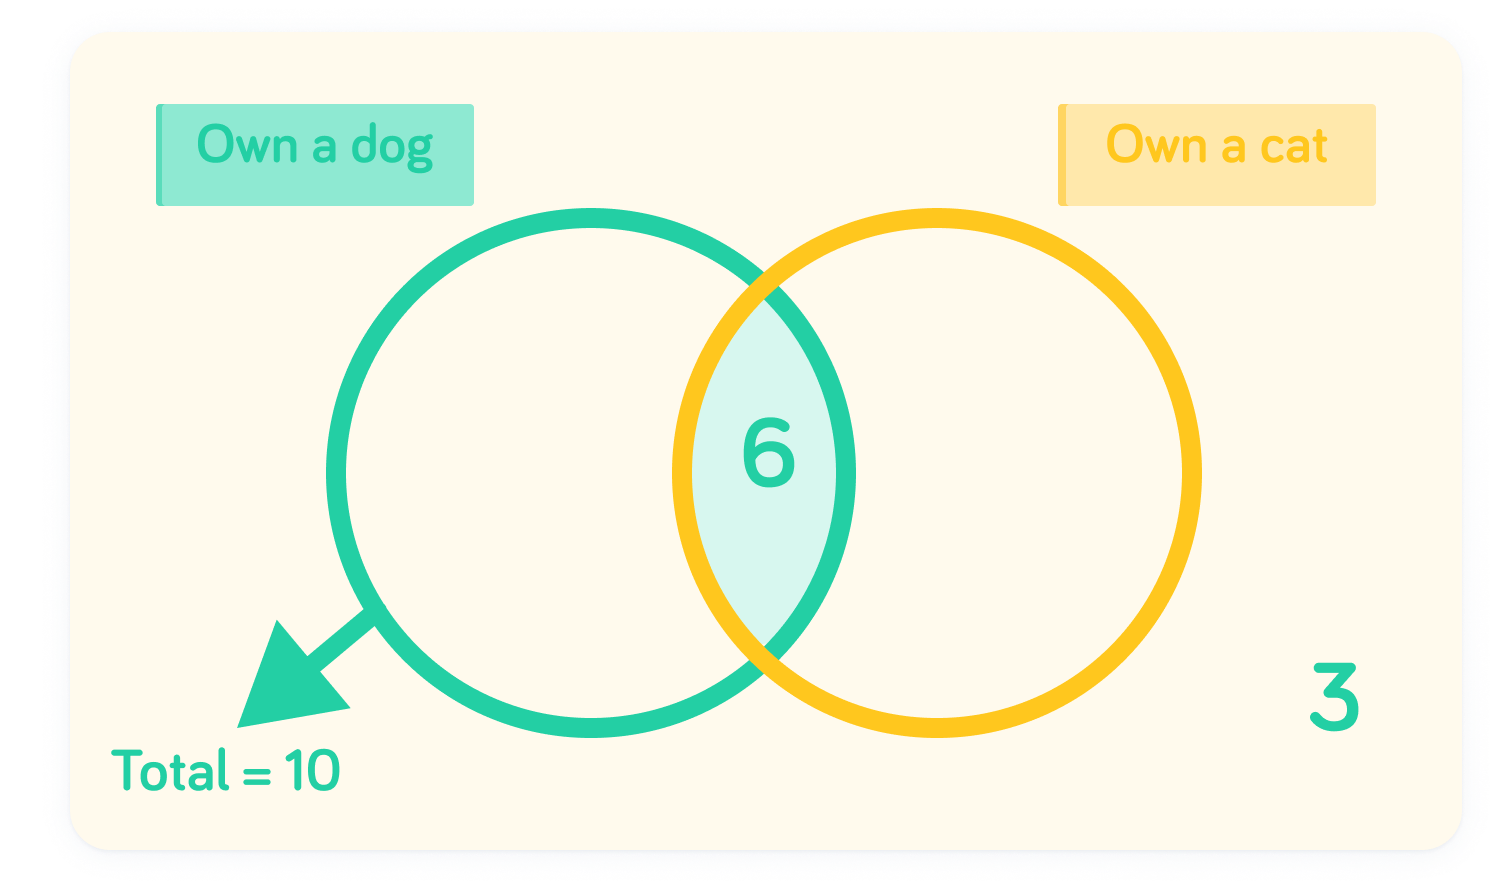
How many people only own a dog?


4 people only own a dog
Since there are 6 who own both a dog and a cat, and 10 in total who own a dog: 10−6=4 people only own a dog.
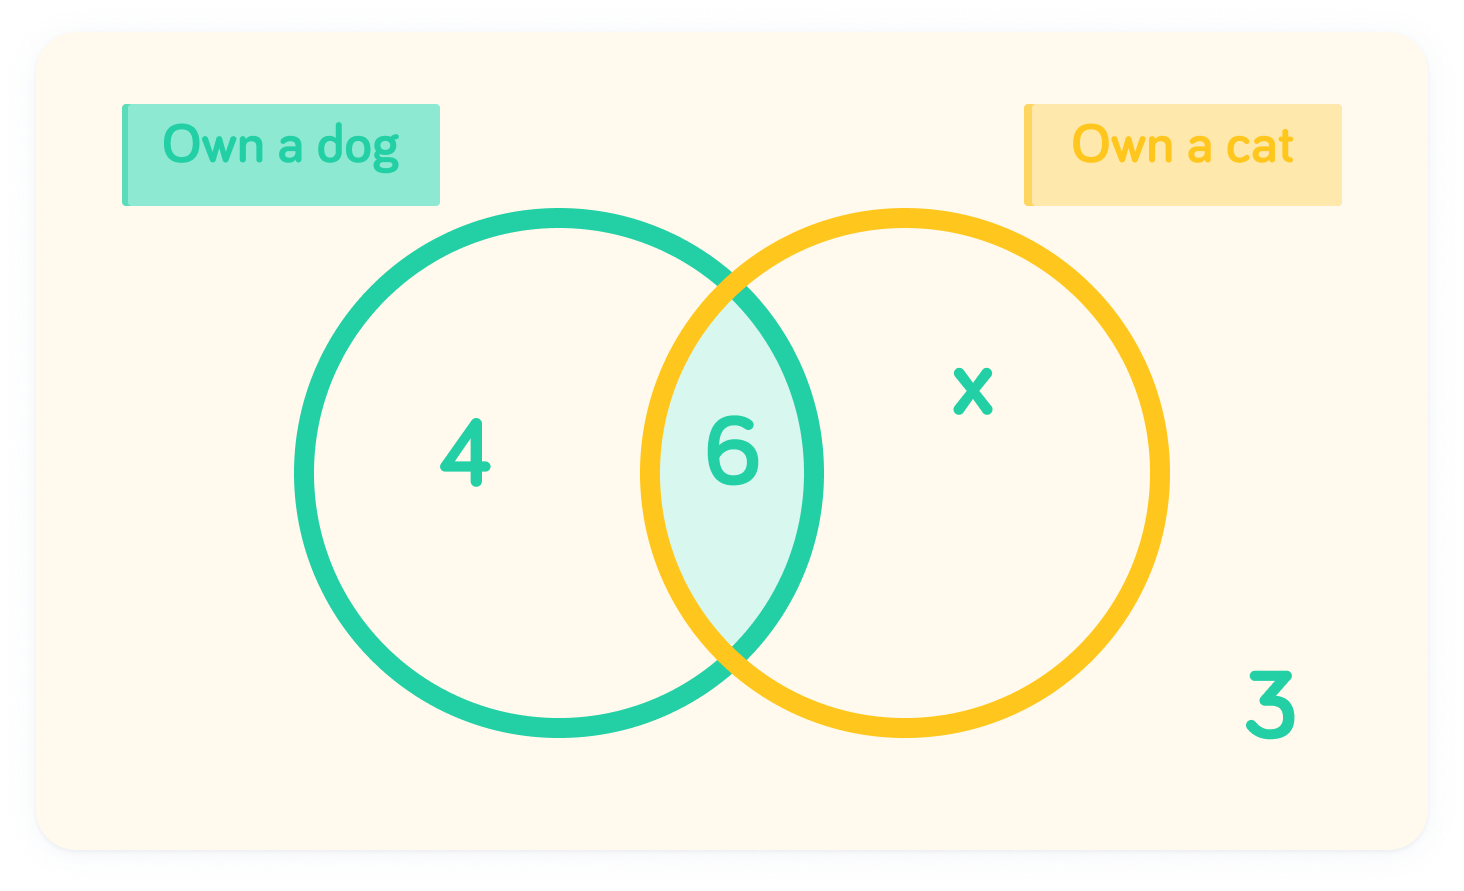
We want to find the number who only own a cat
Since the universal is 20, we can form an equation for x: x+6+4+3=20

If x+6+4+3=20, what is x?


x=7, so 7 people only own a cat
By subtracting 13 from both sides of the equation, we find that x=20−13, so x=7.
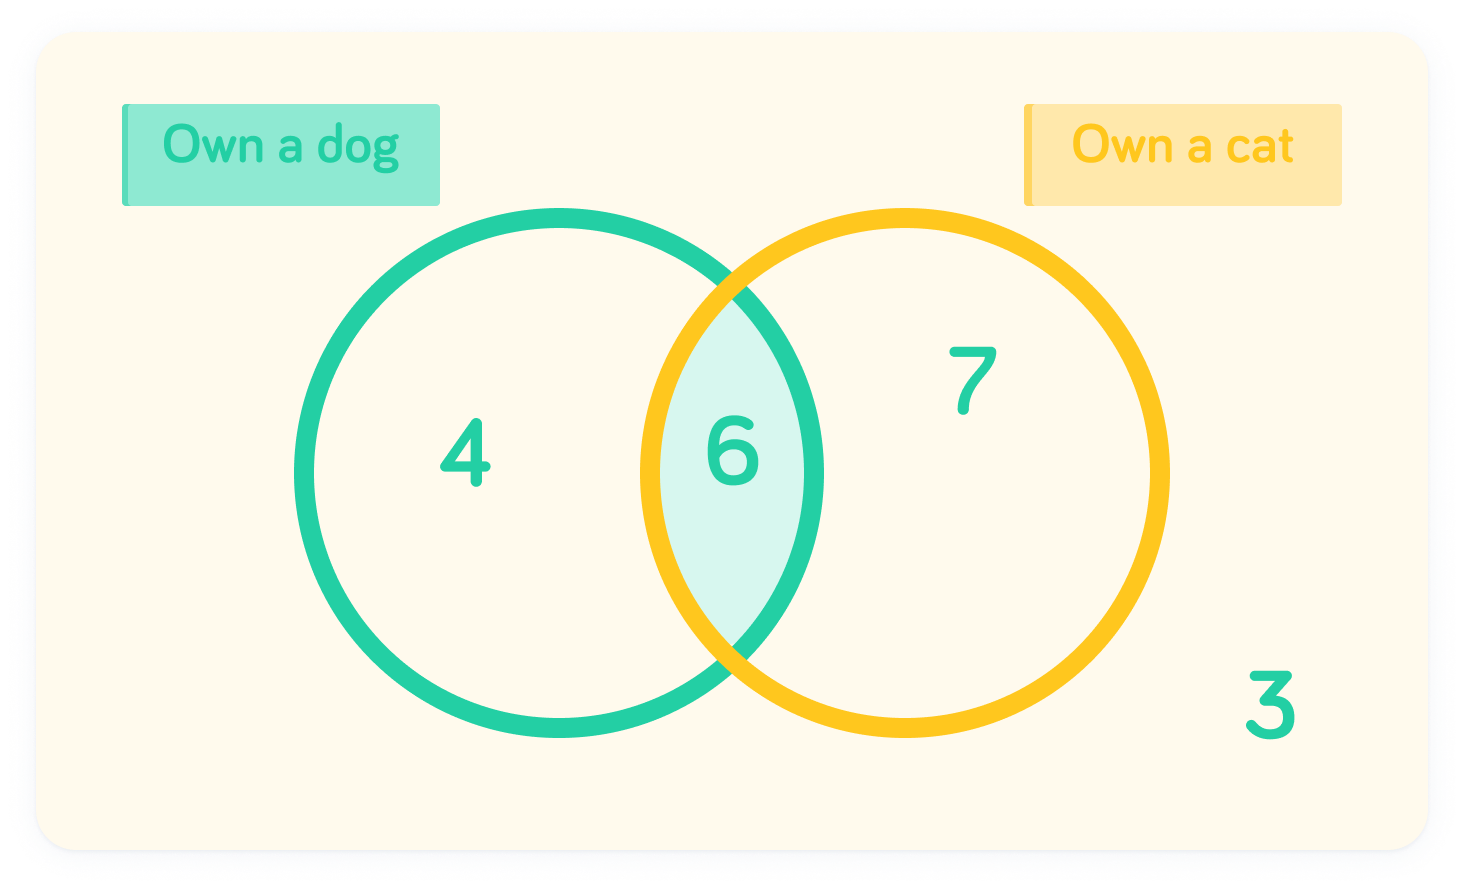
If 7 people own a cat out of the universal 20, what is the probability a randomly chosen person would own only a cat?


The probability of only owning a cat is 207
Since we know the frequencies, we can turn this information into probabilities.

One of the cat owners is picked at random. What is the probability they also own a dog?


The probability they also own a dog is 136
The denominator is 13 here, because the total number of people owning a cat is 13.

A survey asks 60 people if they use the gym or swimming pool
6 people said they were using neither the gym nor the swimming pool. 12 people said they were using only the swimming pool. 50 people said they were using the gym.
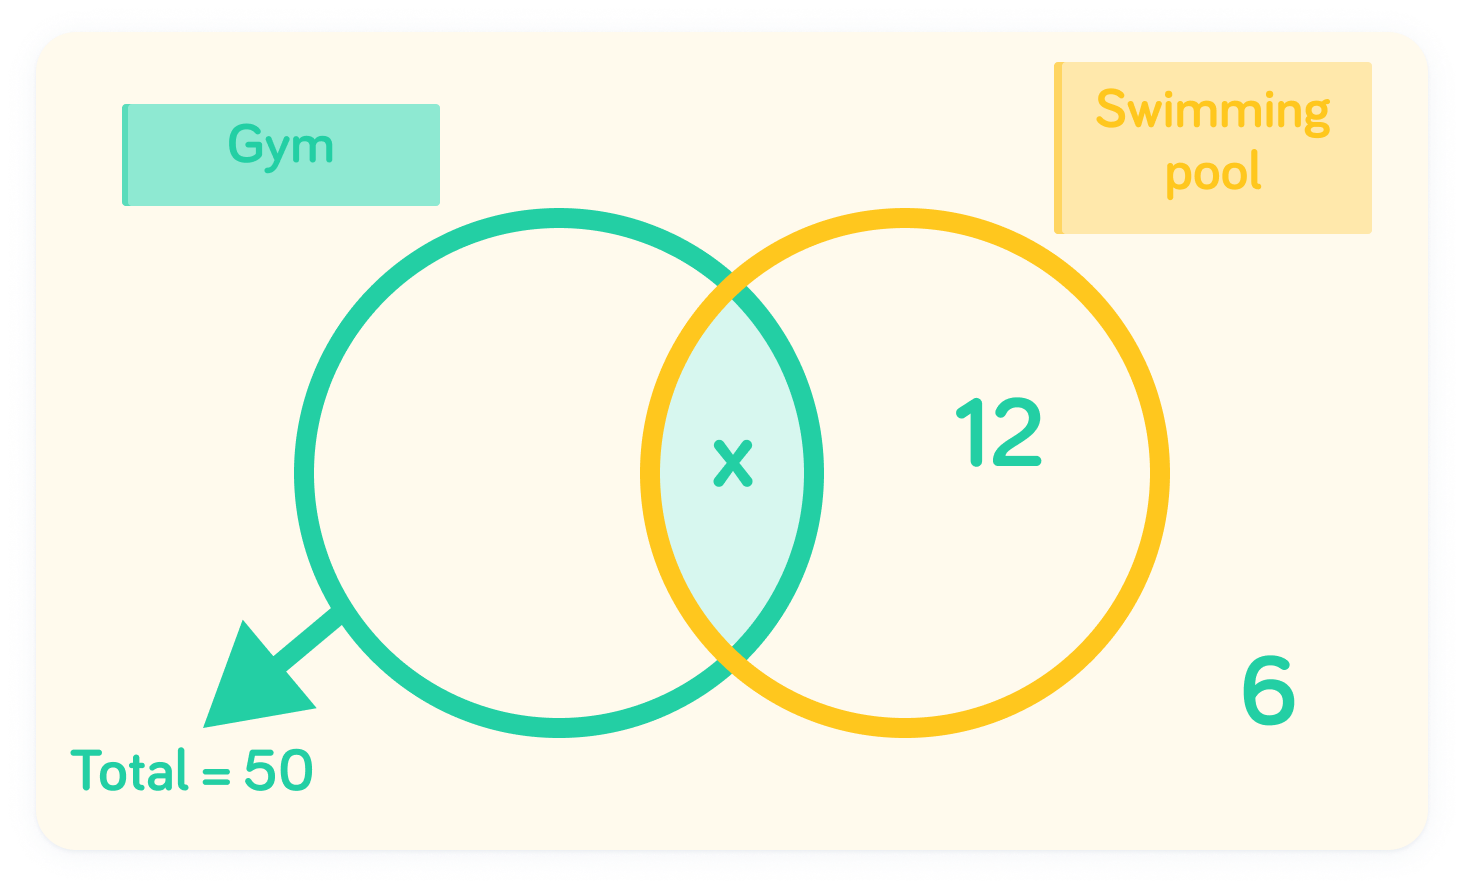
Let's find the probability of a randomly chosen person using both facilities
Notice that we have 2 unknowns here: the intersection and also the number of people that only used the gym. We know that together, these should add up to 50.

It looks like our frequencies don't sum to the total!
50+12+6=68, when the universal is only 60. However, the people that used both the gym and the swimming pool have been accounted for twice. The intersection is therefore the difference between the universal and 68

What is 68−60?


There were 8 people from a total of 60 using both the gym and swimming pool. What is the probability of a randomly chosen person using both facilities?


