YOU ARE LEARNING:
Half-Life Calculations and Curves

Half-Life Calculations and Curves
Half-life is the time it takes for the number of radioactive nuclei in a sample to halve.
This lesson will look at how to calculate the half-life of a sample of radioactive substance. But first, do you remember what the activity of a sample of radioactive substance means?

Can you remember what the two definitions of half-life are?
You can select multiple answers
If the activity of a radioactive sample goes from to in 3 hours, then what is this sample's half-life?
The activity of a radioactive sample goes from to in 4 hours. What is this sample's half-life?
So the half-life of a sample if a radioactive substance has 2 definitions.
The time it takes for the number of radioactive nuclei in a sample to halve.
The radioactive nuclei are the unstable isotopes in the sample.
The time it takes for the activity of a sample to halve.
The activity is the overall rate of decay of the sample, measured in Becquerels (Bq).
We can show the process of radioactive decay with a graph.
We have plotted the number of unstable nuclei in a sample against time in minutes.
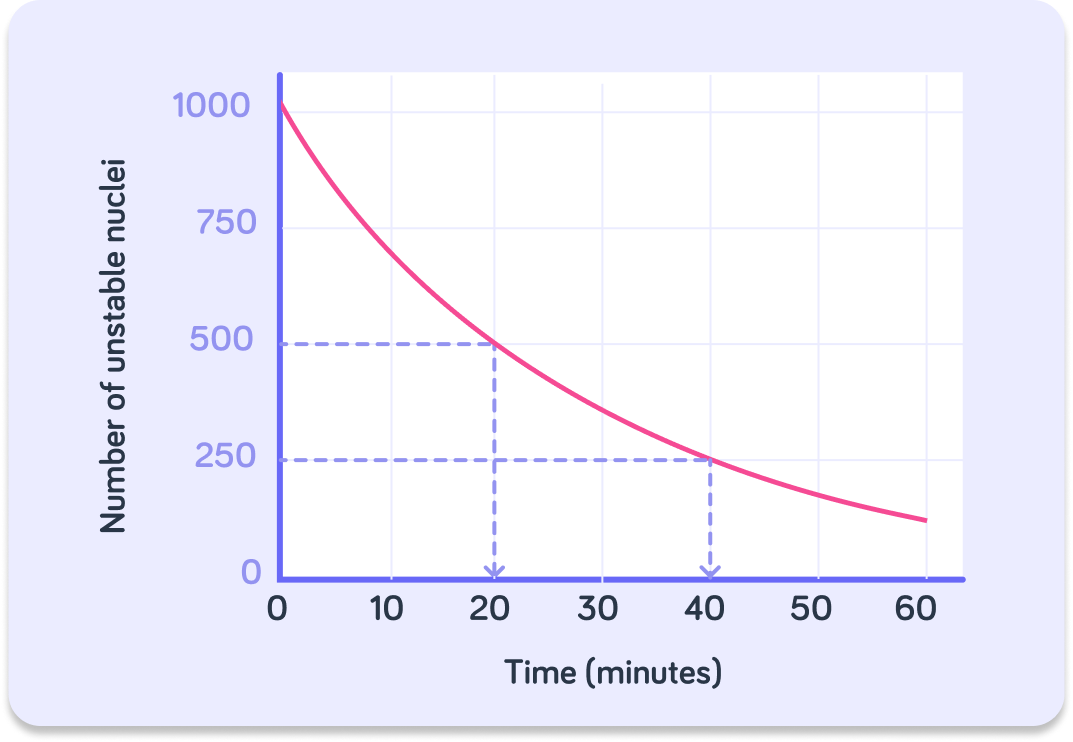
As time goes on, the number of unstable nuclei that decay declines. Why is it a curved and not a straight line?
A) Because the rate of decay is constant. B) Because the number of nuclei that decline per minute also declines. C) Because the rate of decline of the nuclei increases.
So the graph shows that the number of unstable nuclei in a radioactive sample decreases over time.
This means that the rate of decay (the activity) decreases as well. This is why the line is curved and not straight.
What is the initial number of unstable nuclei in this sample?
To find the half-life for this sample, you should go down to ________ on the y-axis.
So to find the half life, we figure out how long it takes for the number of nuclei to halve. How long does it take for the nuclei to go from 1000 to 500?
We can check if what we calculated is correct by doing it again. How many nuclei are left after another 20 minutes have gone by?
We can also find the half-life from plotting the activity of a radioactive sample against time.
Notice that the y-axis here is activity (Bq), not number of nuclei.
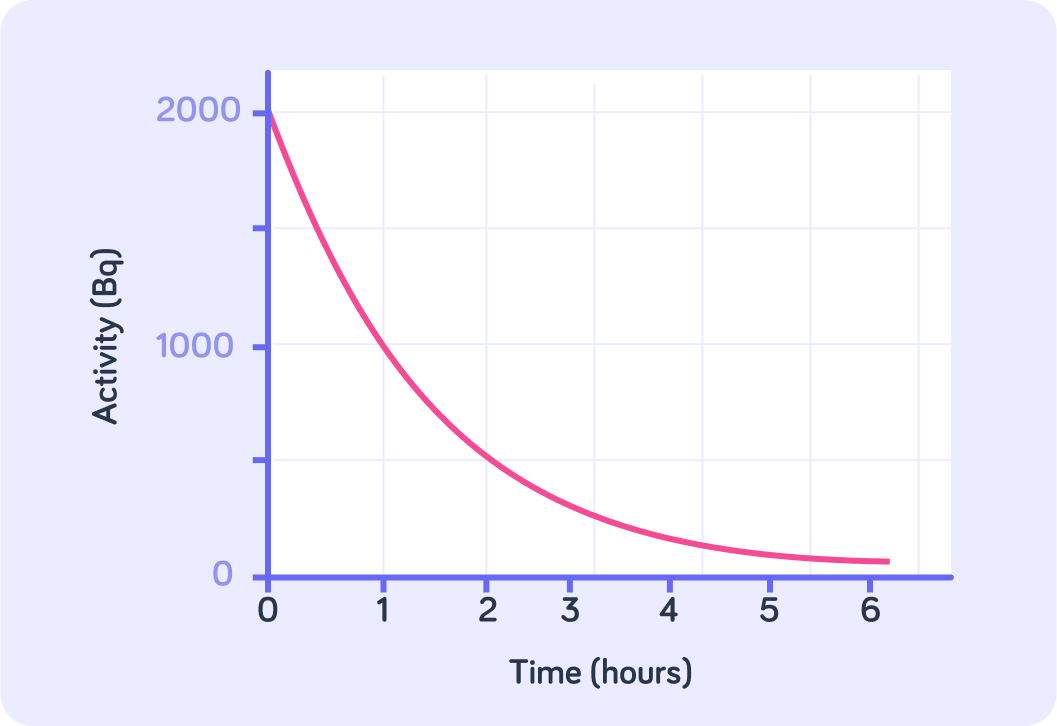
What is the initial activity of this sample?
What is the half life of this particular sample?