YOU ARE LEARNING:
Cubic Graphs

Cubic Graphs
Cubic graphs are curved graphs, where the highest power of x is 3. A table of values can be used to work out each point on the graph.
Cubic graphs are functions where the highest power of is . They can have a variety of shapes depending on the specific function being displayed.
Let's draw the graph of
For each coordinate, we can find the corresponding coordinate by ....
.... substituting the value into the equation.
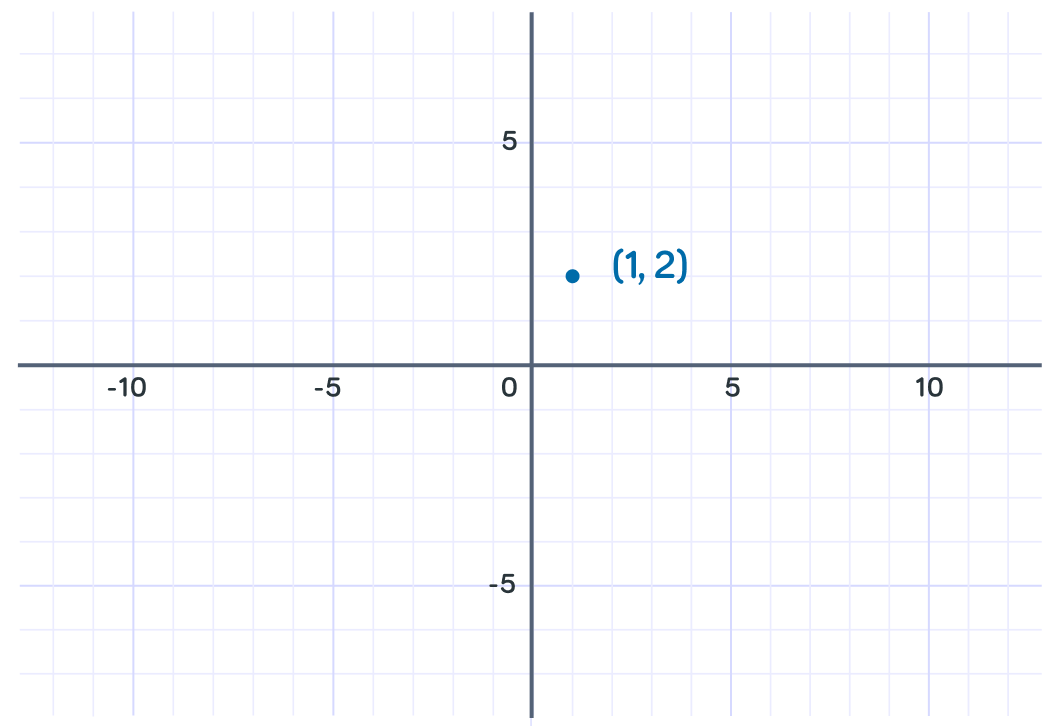
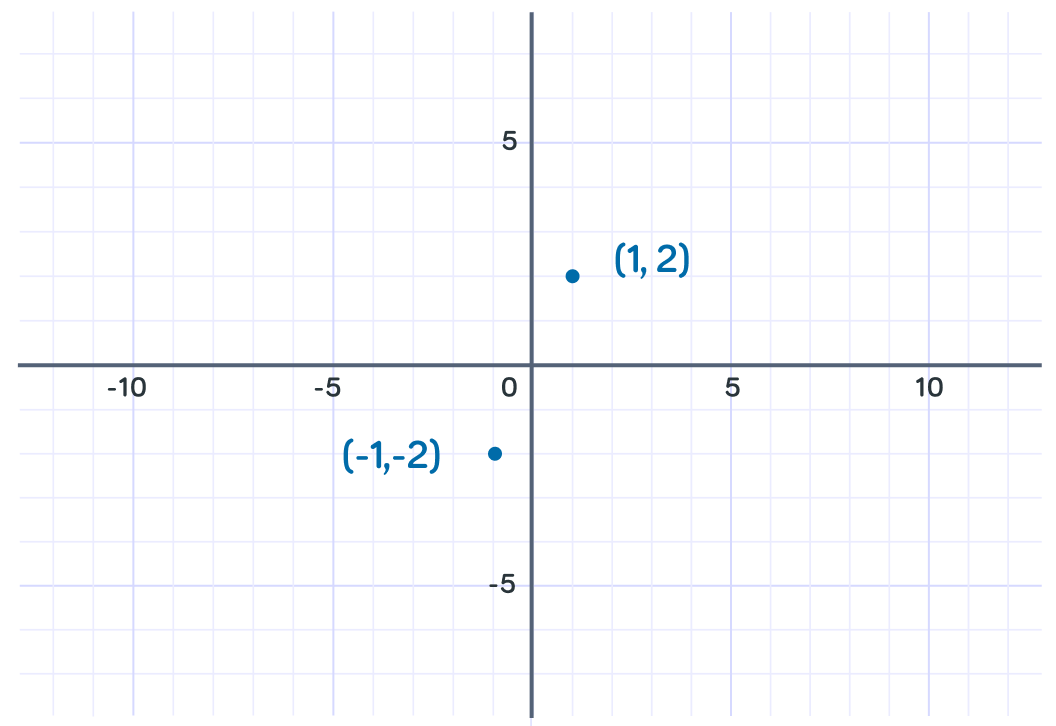
For example, when ,
so . We can plot this point on the graph at
What is when ?

When ,
This is because . Remember that a negative multiplied by a negative equals a positive. We can plot this point at
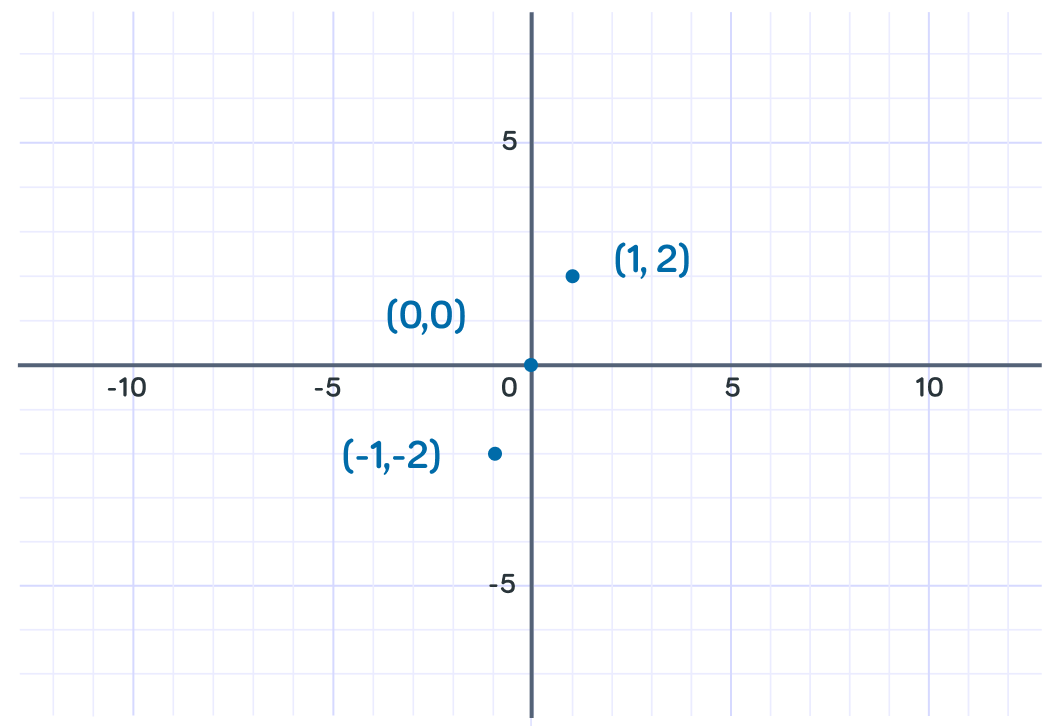
What is when ?
When , .
We can plot this point at . Let's try filling out a few more values in a table.
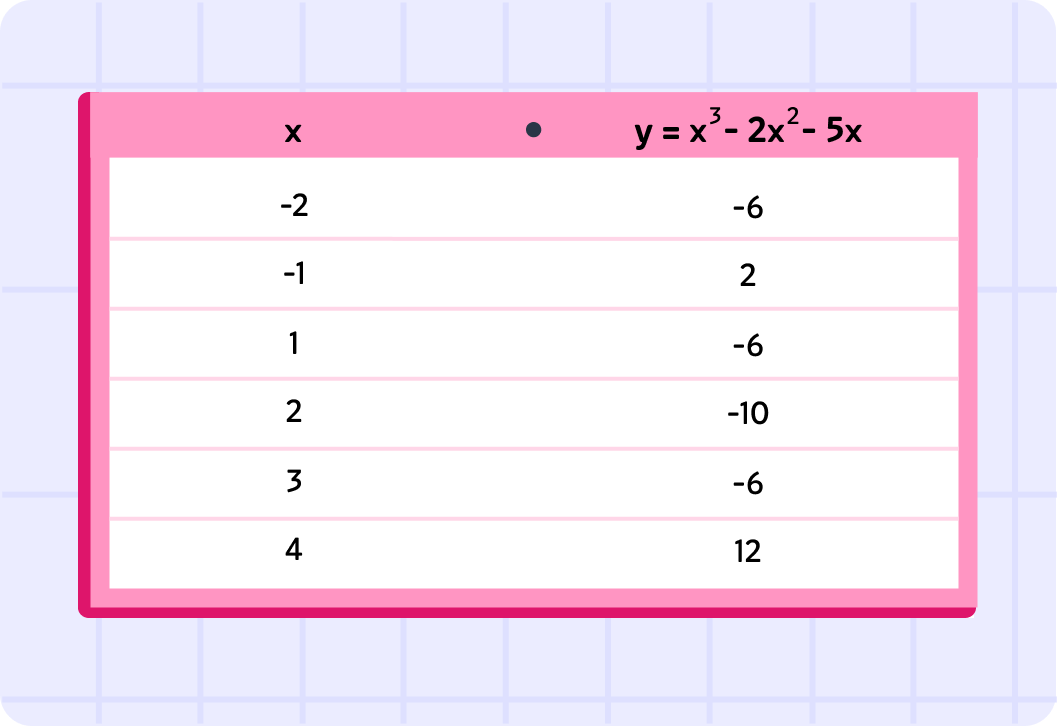
The graph of
We can use a table of values to help find points which will allow us to draw a cubic graph.
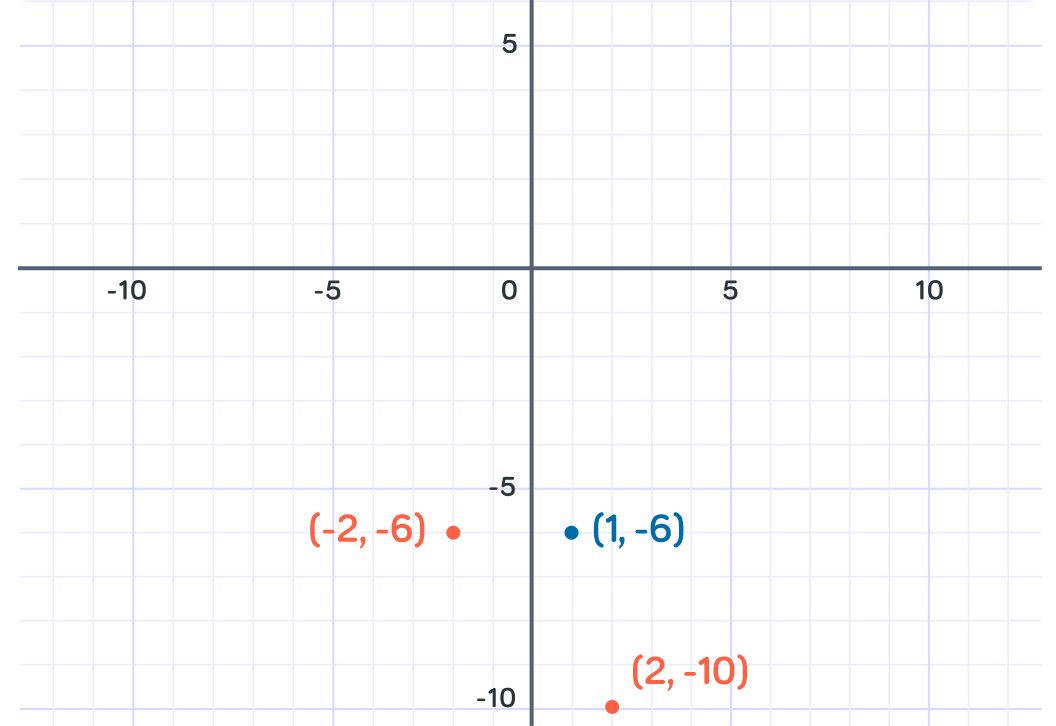
In this table we can see the points we have already calculated for when .
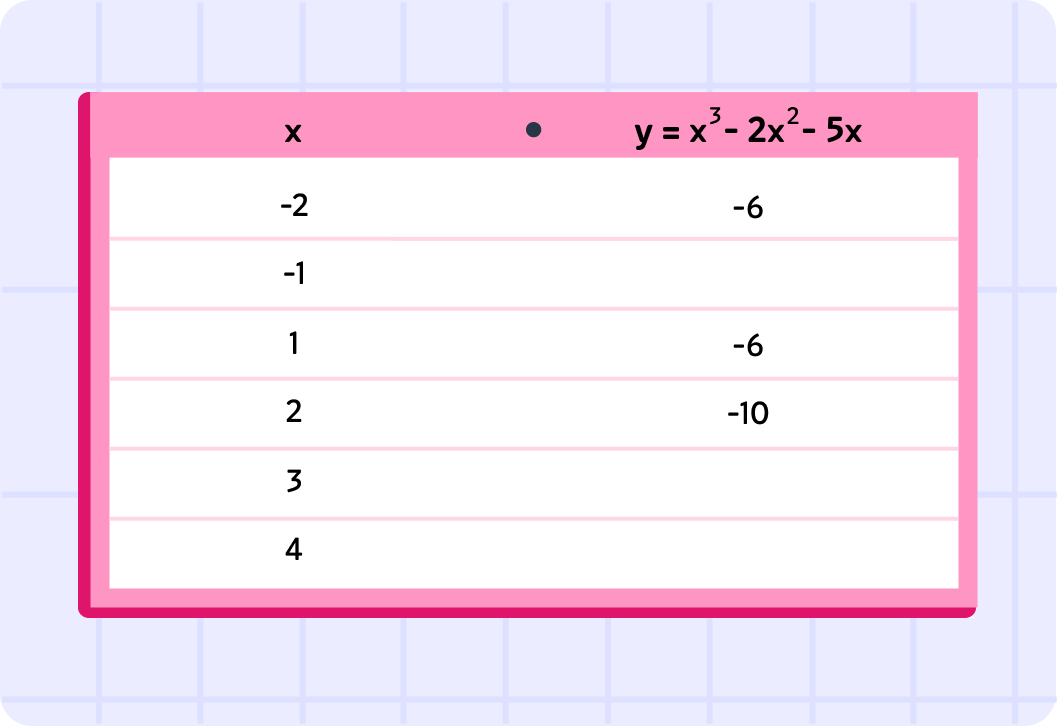
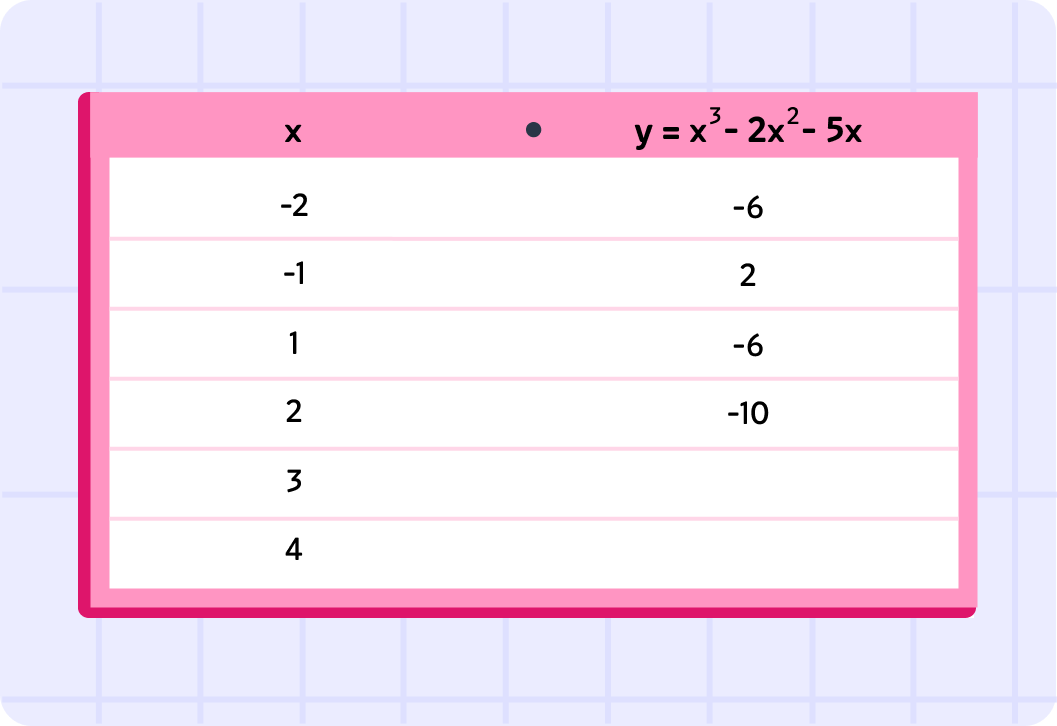
Let's fill this table out so we have more points to help us find the curve. What is the y-coordinate for when ?
What is the y-coordinate for the point when ?
What will be the point when ? Give your answer in the form .
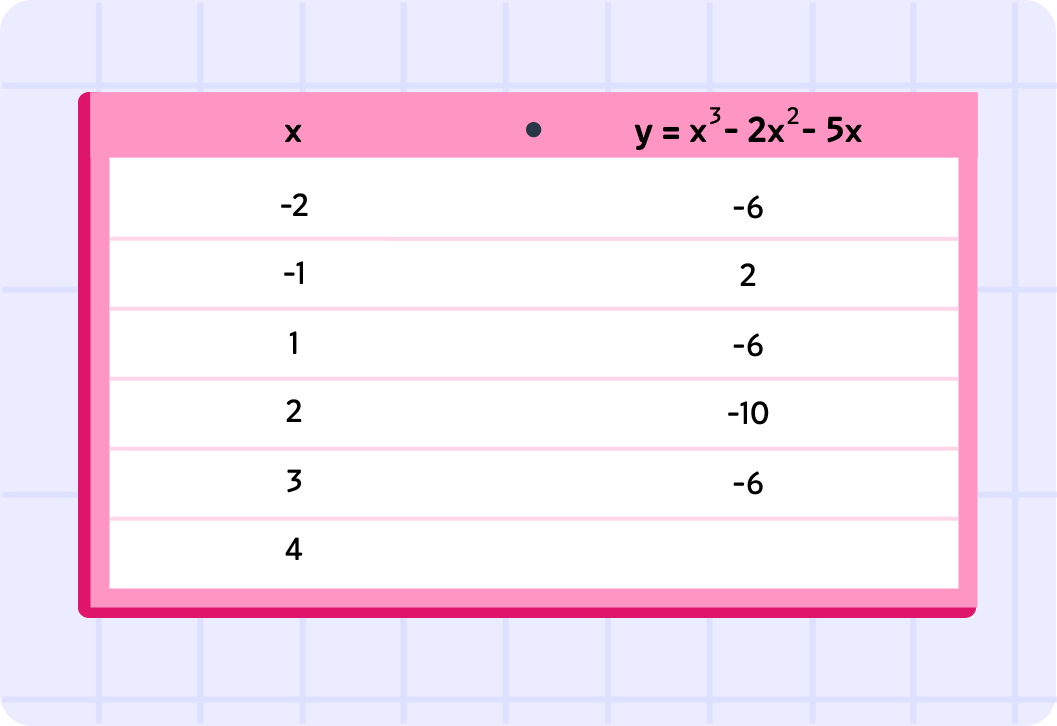
Nice!
Now we have enough points to draw a line.
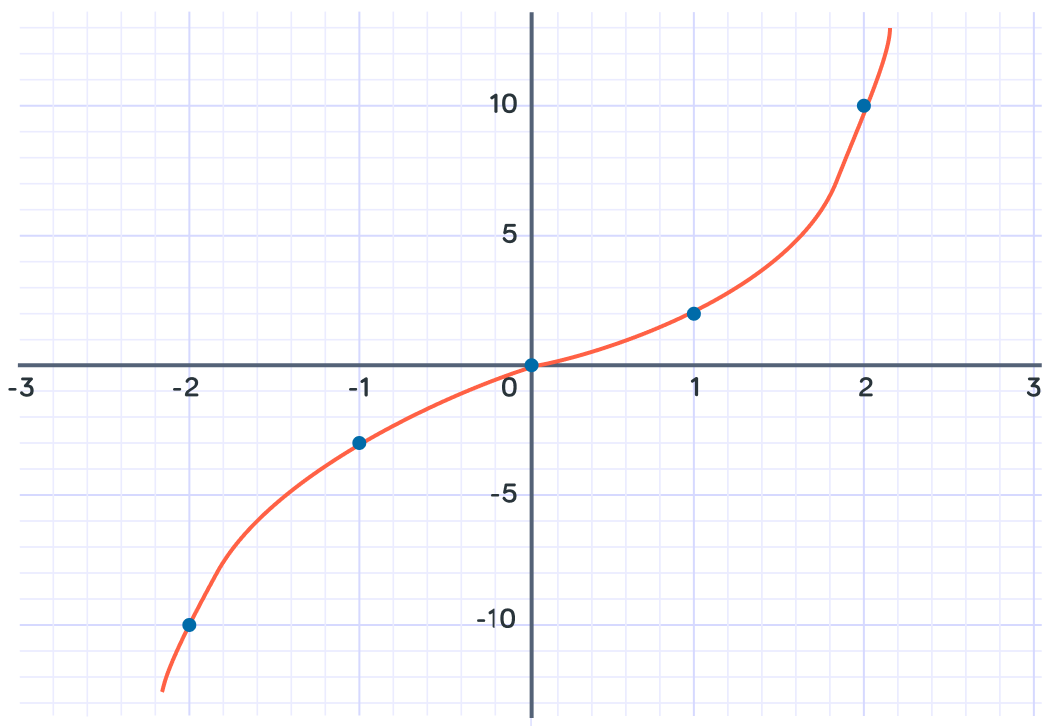
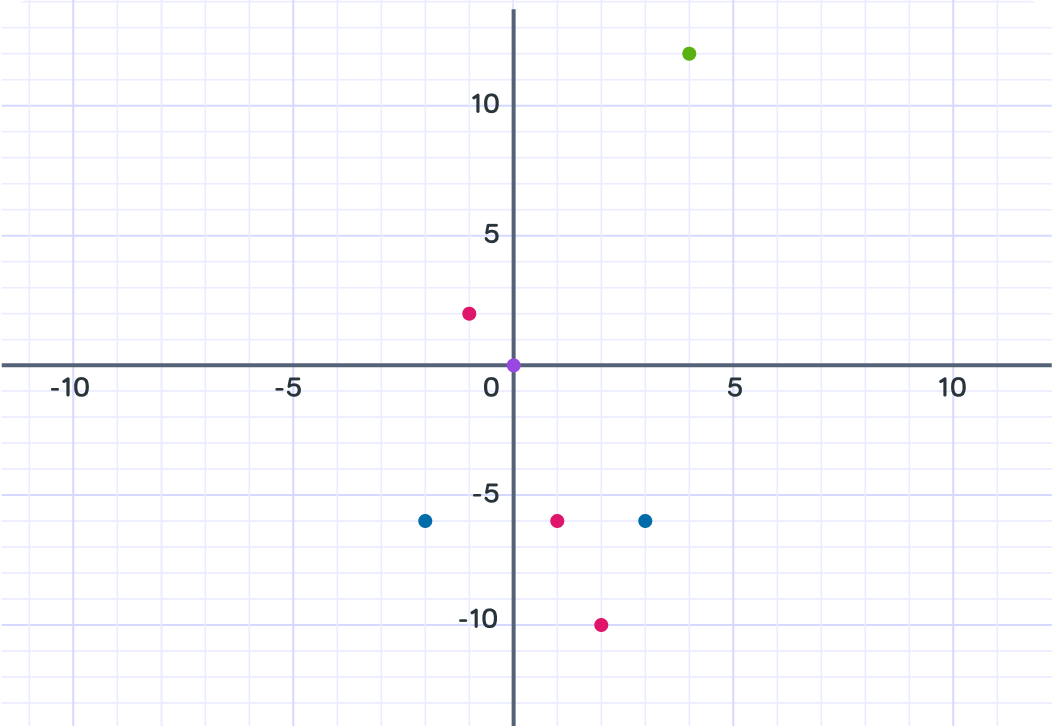
the graph of
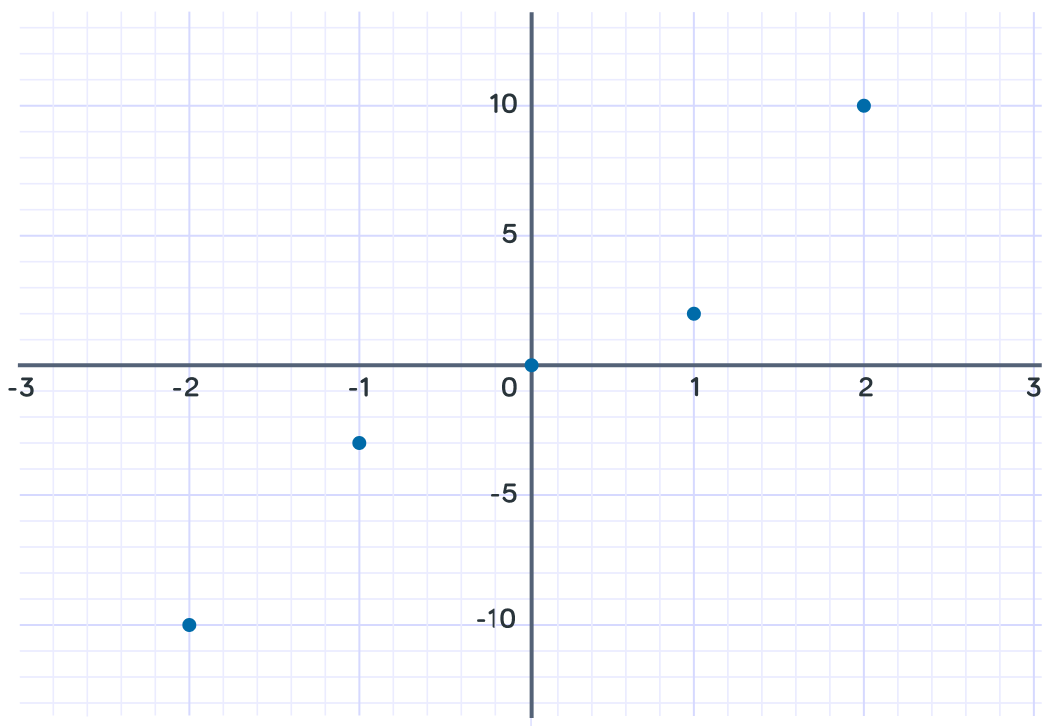
Here we can see all the points we calculated plotted on the graph.
Now all we need to do is join these points up with a smooth curve.
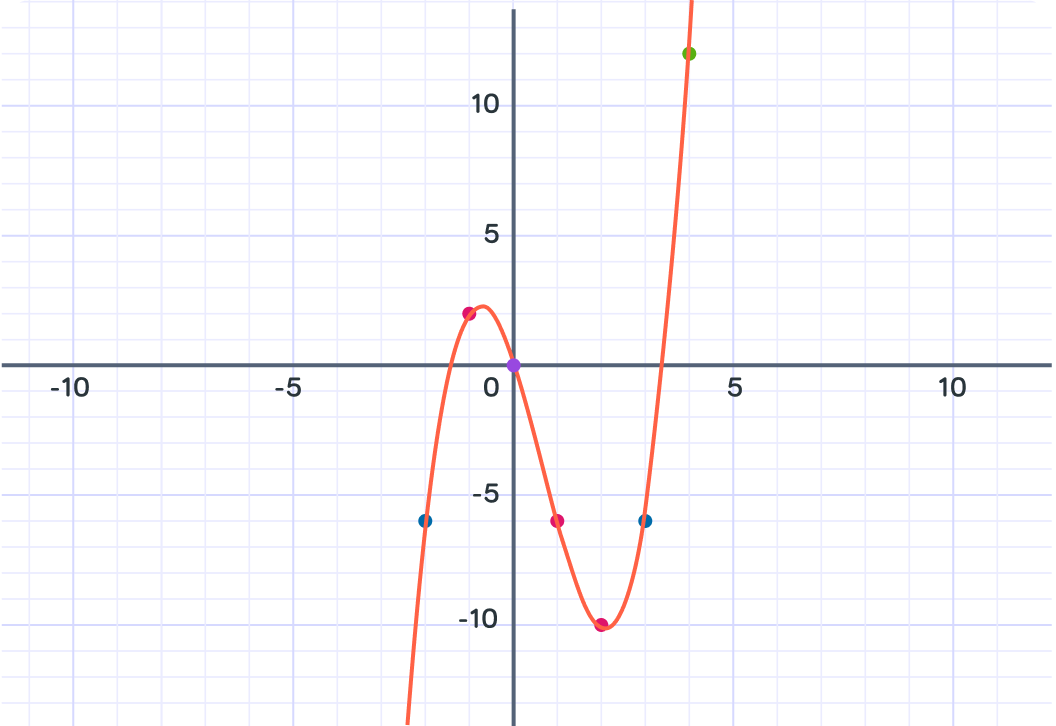
Awesome!
This is the line of .
Let's draw the curve of
Remember, we can find values of by substituting values of into the equation.
Let's give it a go
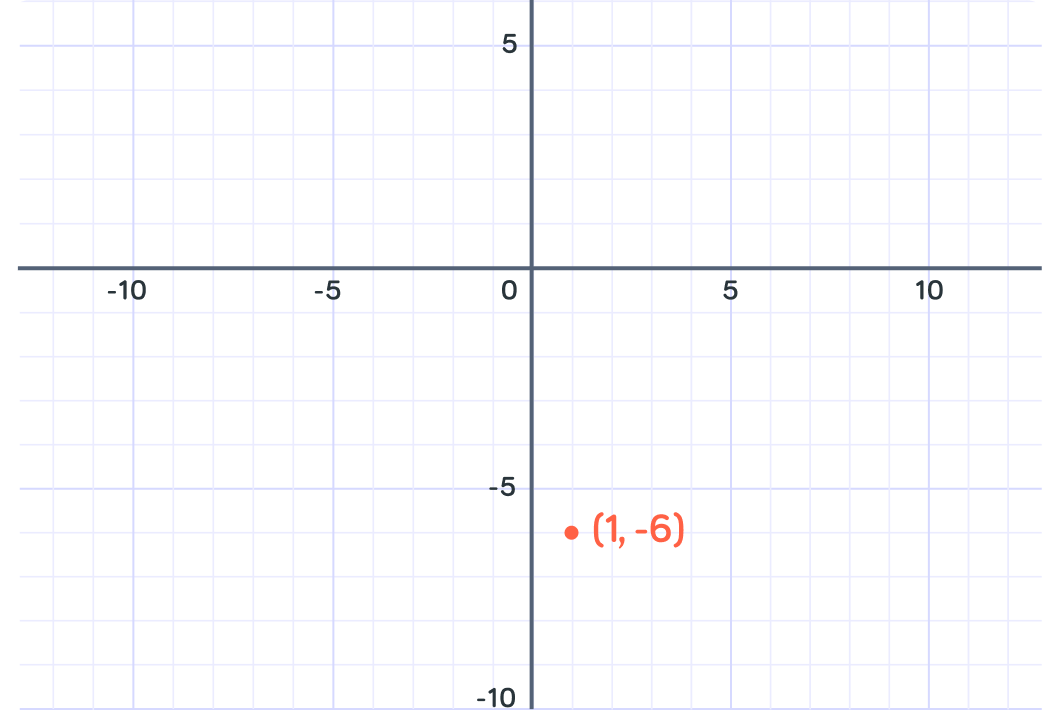
What is when ?
What is when ?
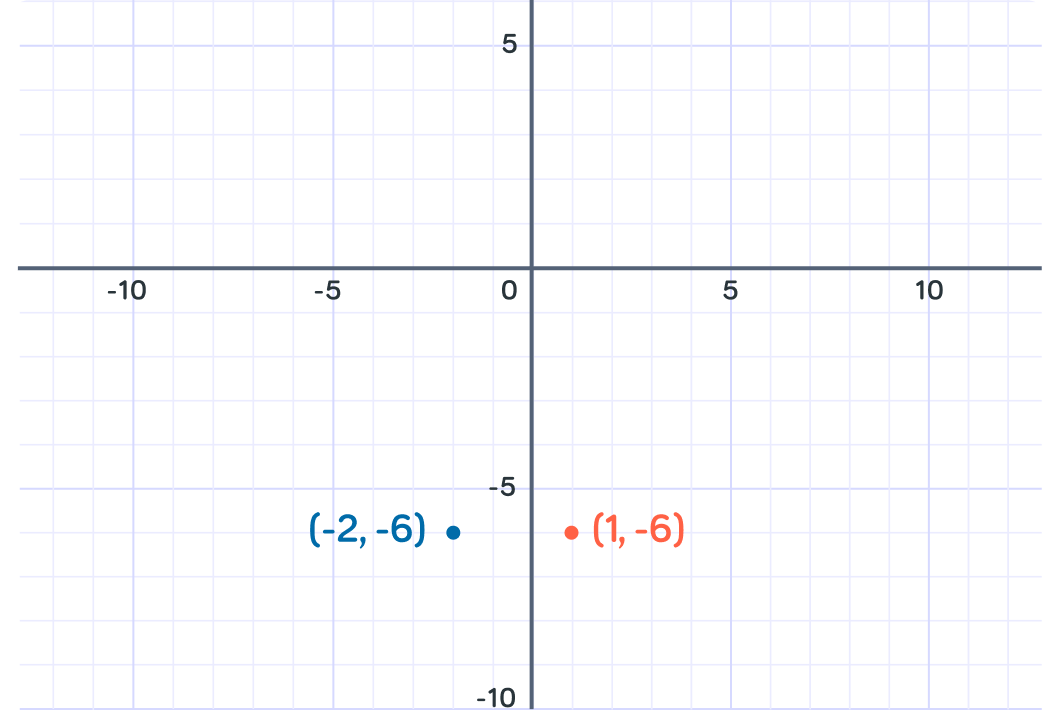
Does the curve pass through the origin, ?
What is when ?
Awesome! We have enough points
Now we can draw a line to smooth join the points together.
This is the line of
Nice!