YOU ARE LEARNING:
Quadratic Graphs

Quadratic Graphs
Quadratic graphs are curved graphs where the highest power of x is 2. We use a table of values to figure out each point on the graph.
Quadratics are any graph where the highest power of is . They have a distinctive U-shaped curve, which is symmetrical.
Let's try the equation
This means that for every value....
... is the square of plus
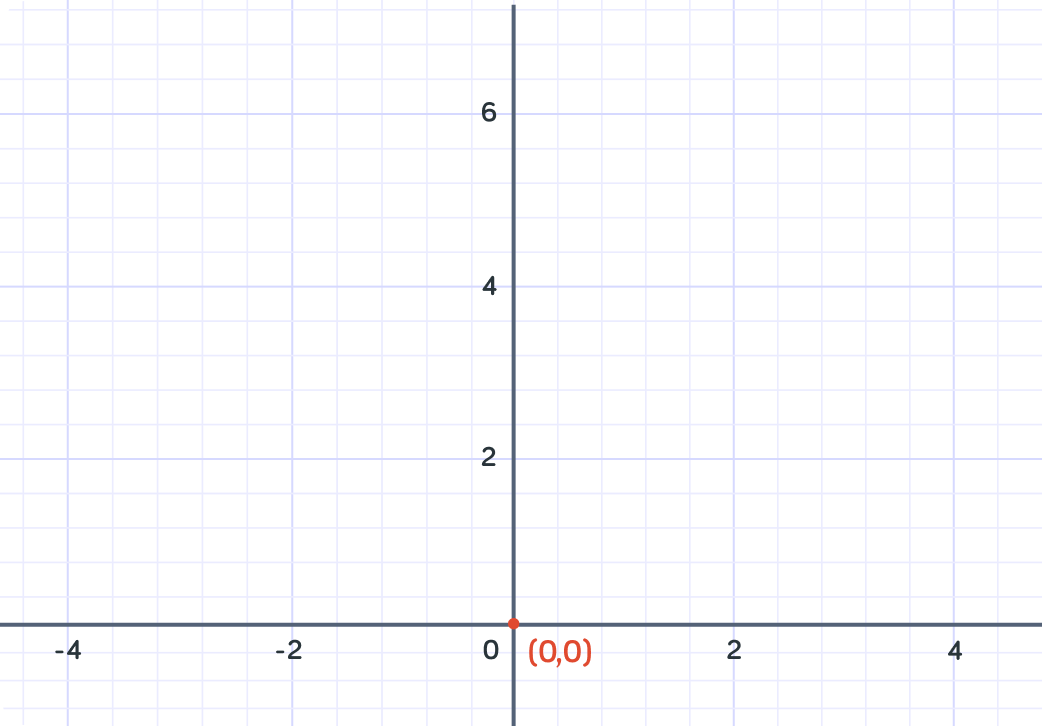
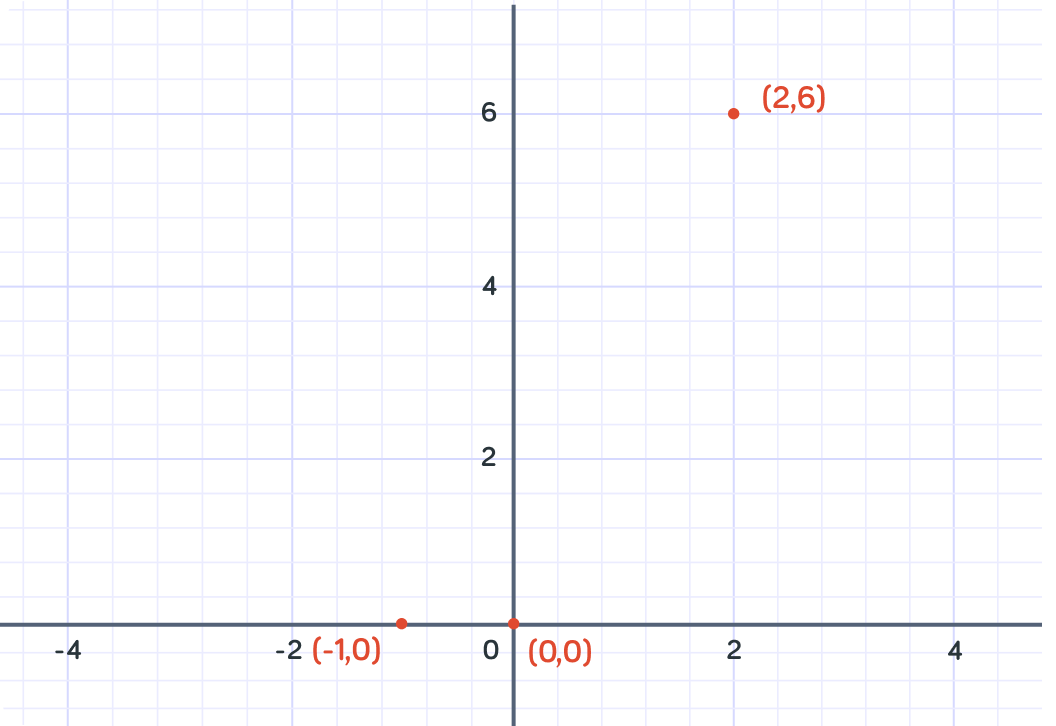
What is equal to when ?

So when ,
We can plot this point on the graph at the coordinates .
What is when ?
So when ,
We can plot this point on the graph at the coordinates
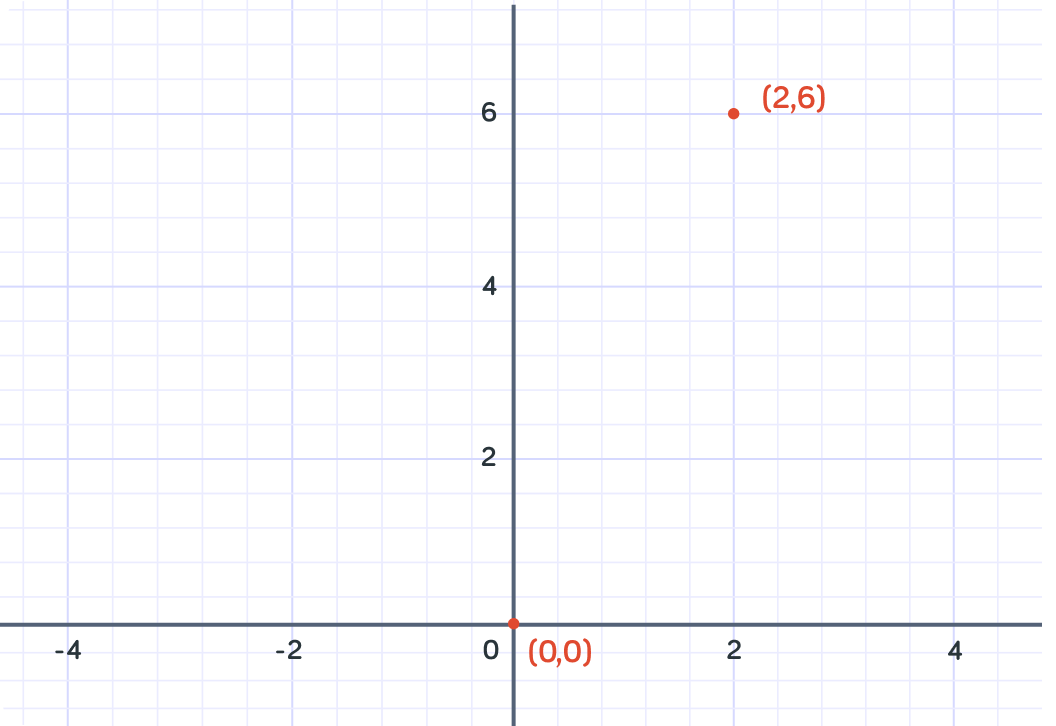
What is when ?
So when ,
We can plot this point on the graph at the coordinates . Notice that the line crosses the x-axis twice!
Let's calculate one more point. What is when ?
Nice!
Now we have enough points to join up to find the line
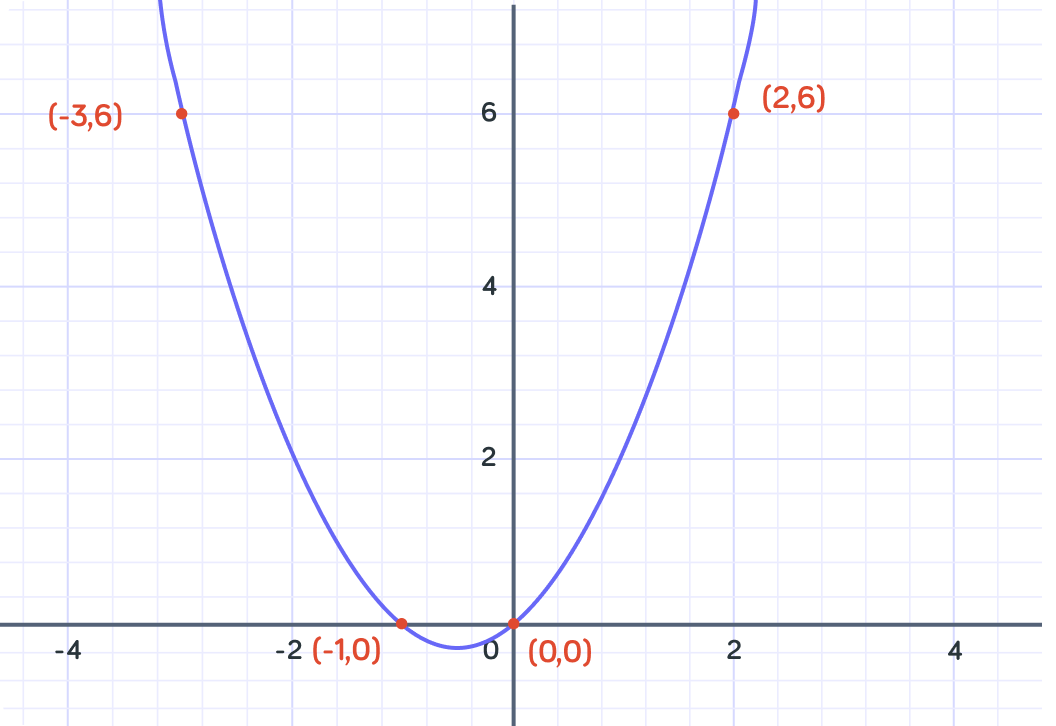
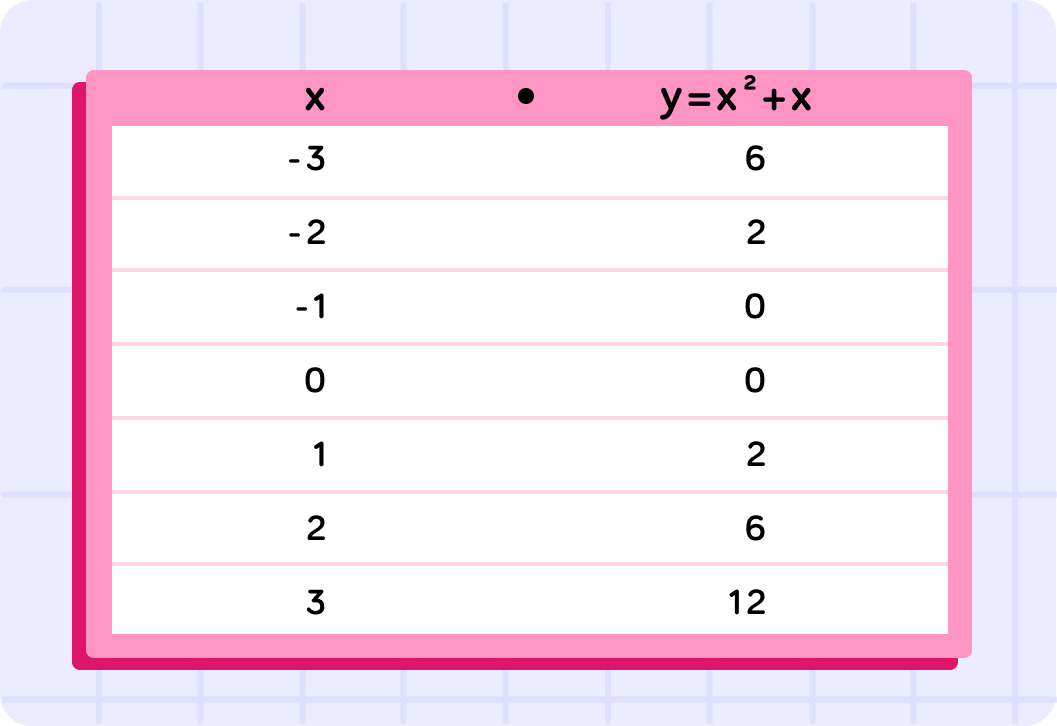
The easiest way to draw a quadratic is by first completing a table of values, then plotting the points and joining them up with a smooth curve.
In the table above we can see the values for that we have already calculated.

Some values of are missing. What is when ?
What will the y-coordinate be for when the x-coordinate is 1?
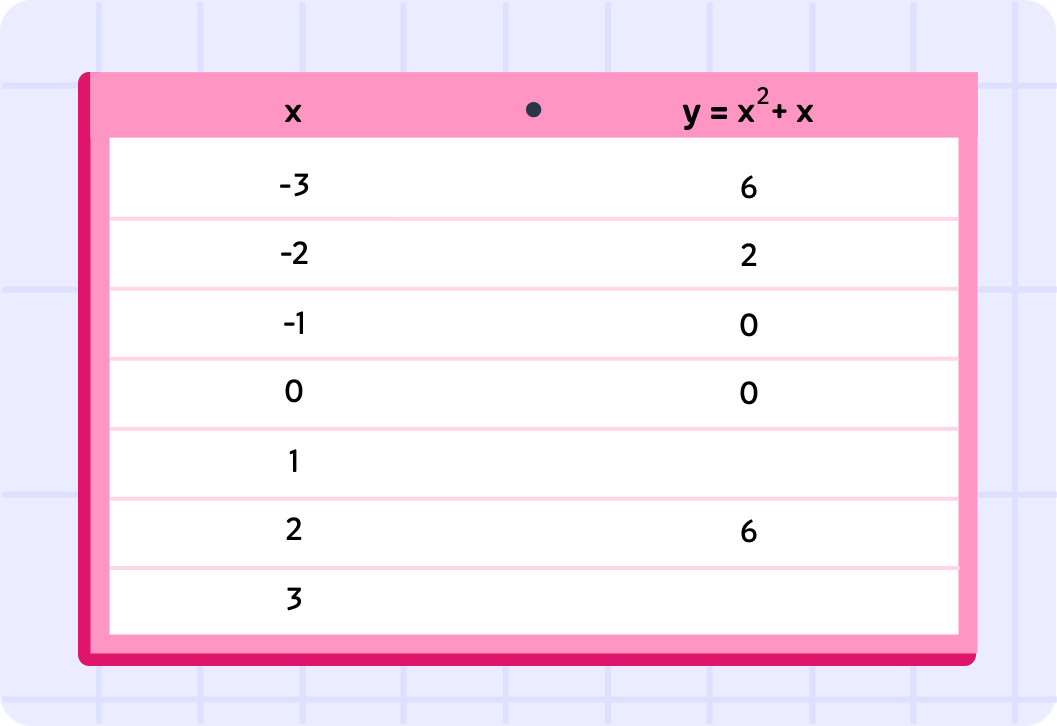
Finally, what will the point be along the curve at ? Give your answer in the form .
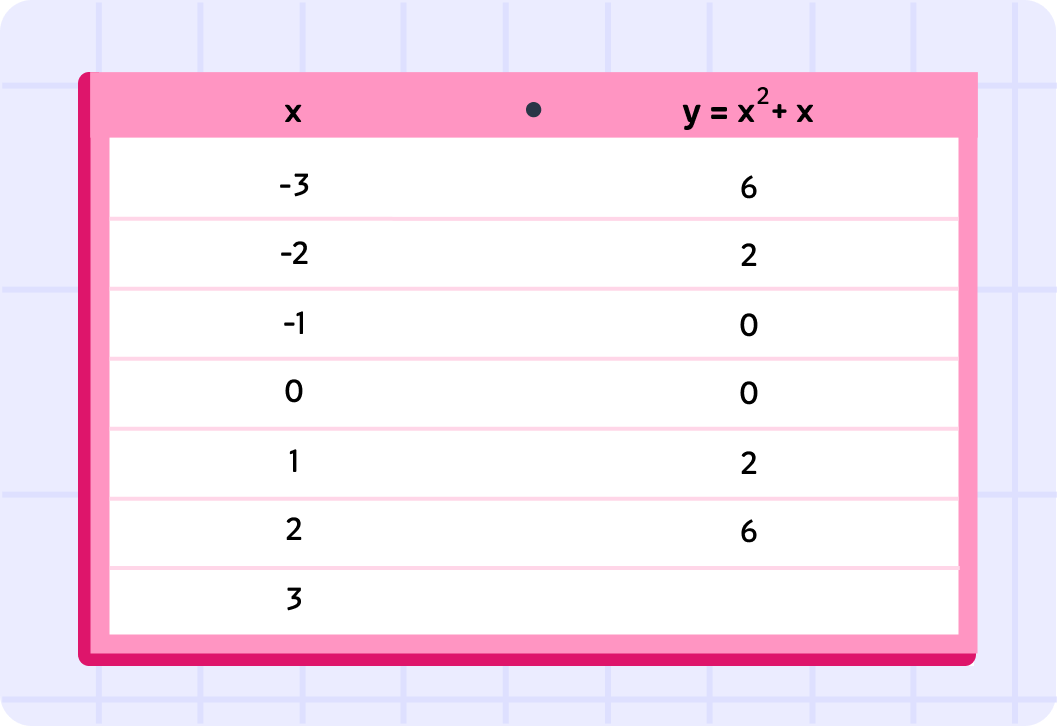
So here is the completed table of values for .
You might notice that the values are symmetrical around . This is because the line is a symmetrical curve!