YOU ARE LEARNING:
Box and Whisker Plots

Box and Whisker Plots
Box and Whisker plots summarise the key statistical values in a single diagram. They include quartiles, the median and the interquartile range.
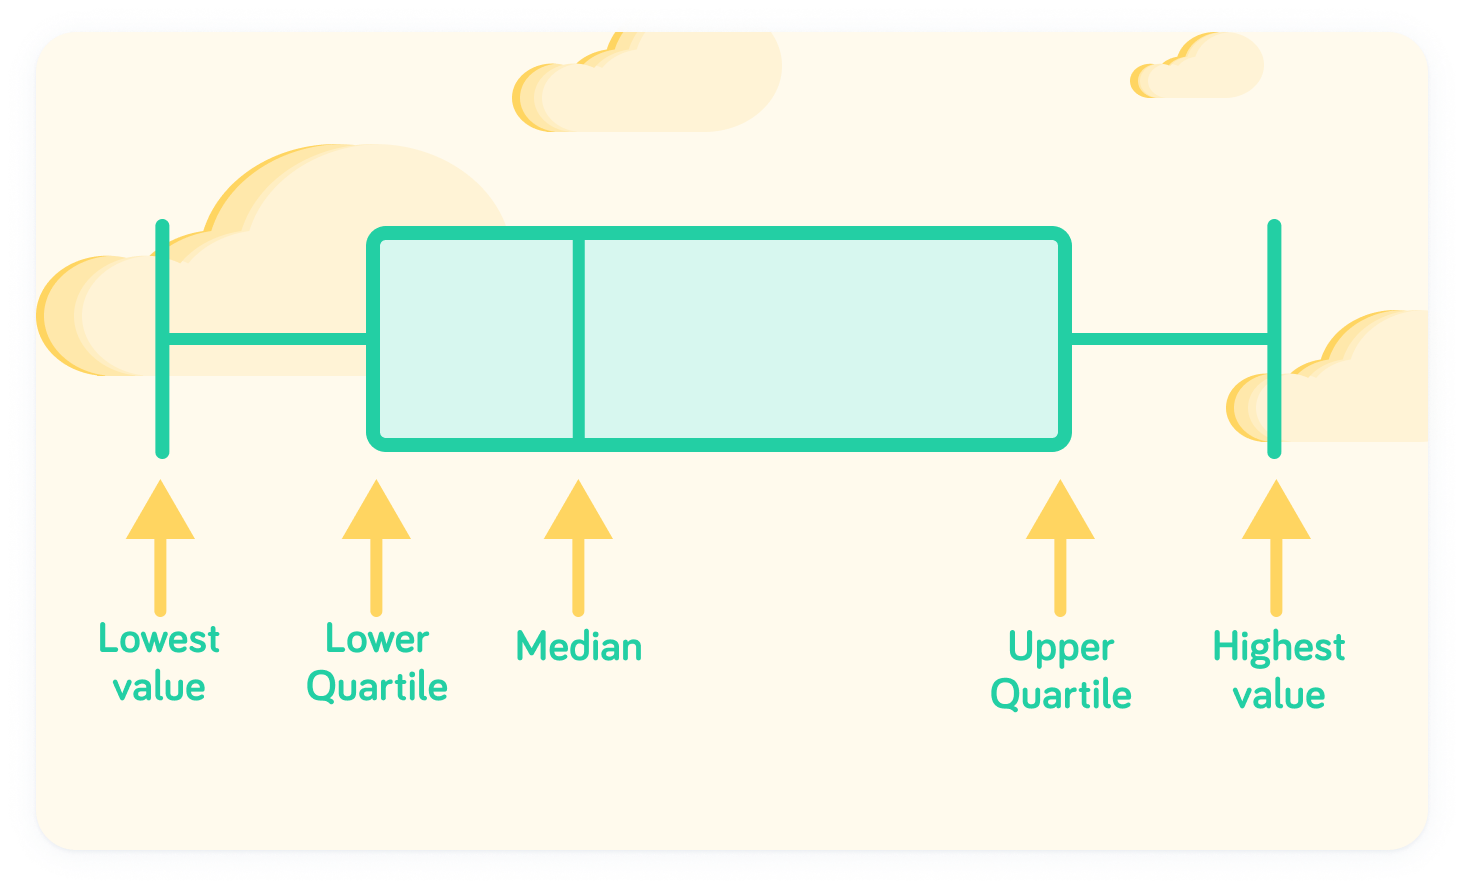
A box and whisker plot is a statistical diagram that summarises a data set in five key values: the lowest value, the lower quartile, the median, the upper quartile and the highest value.
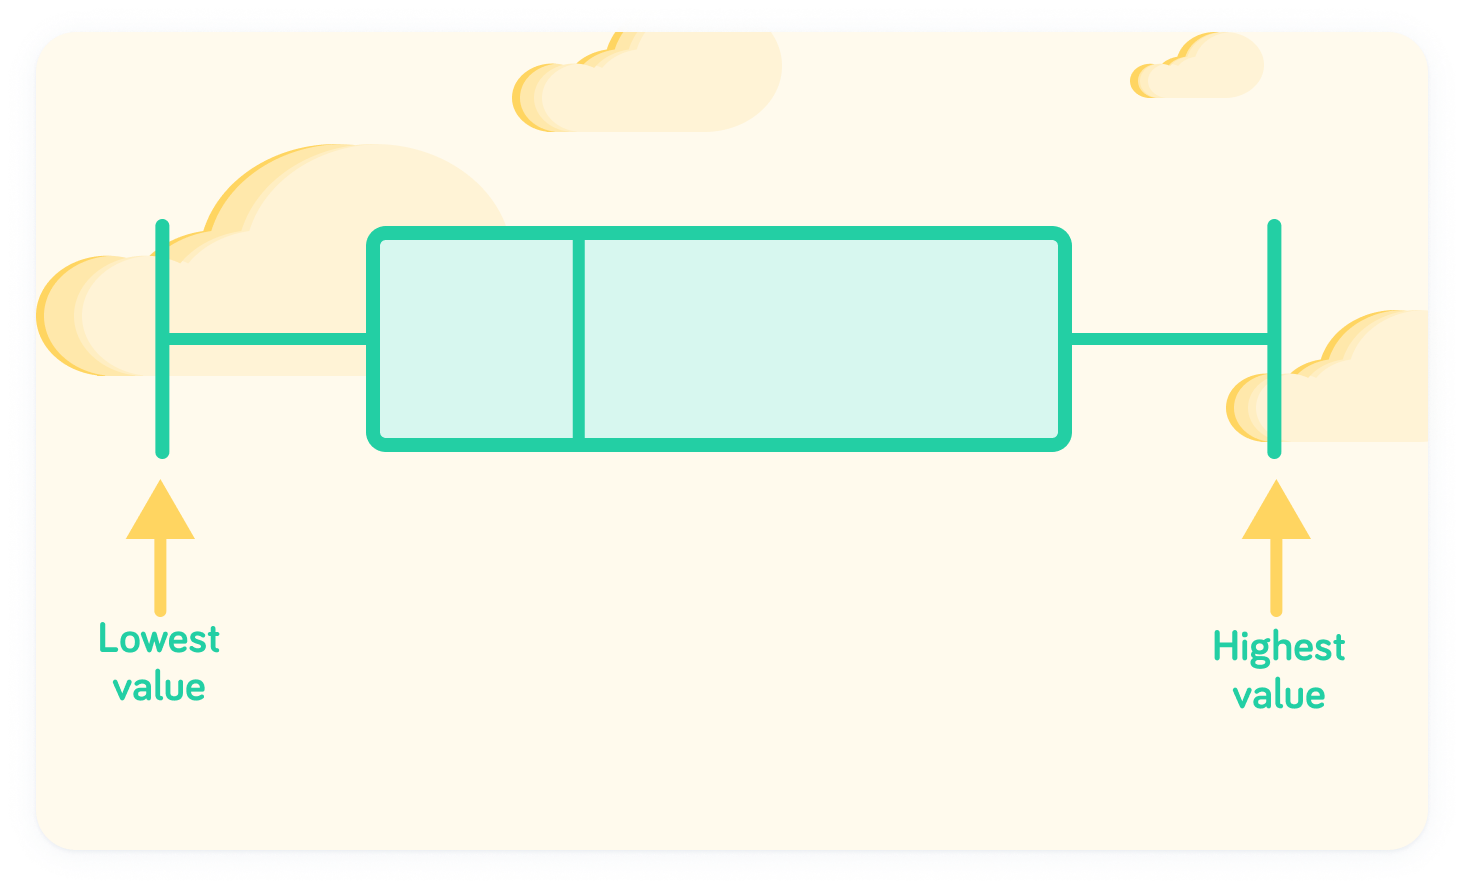
The 'whiskers' represent the largest and smallest values
The whiskers are the vertical lines at each end of the diagram.
The box contains multiple values
The outer edges of the box represent the lower and upper quartiles. Therefore, the box represents the middle 50% of the dataset. The line inside the box represents the median.
What do the ends of the whiskers in a box and whisker plot represent?

What does the line inside the "box" represent in a box and whisker plot?