YOU ARE LEARNING:
Histograms: Estimating the Median

Histograms: Estimating the Median
We can use a special method called linear interpolation to find the median from a histogram.
Histograms are plotted from grouped data, so we can't be sure of the individual data they represent. We use a special method to estimate the mean since we cannot observe it directly.
This method is called linear interpolation. It involves finding a proportional relationship between the position and value of the median within its grouped interval.
What is the correct formula to find the frequency after observing a histogram?

Here is a table with the intervals, frequency densities and frequencies
We can calculate the frequency with the formula .
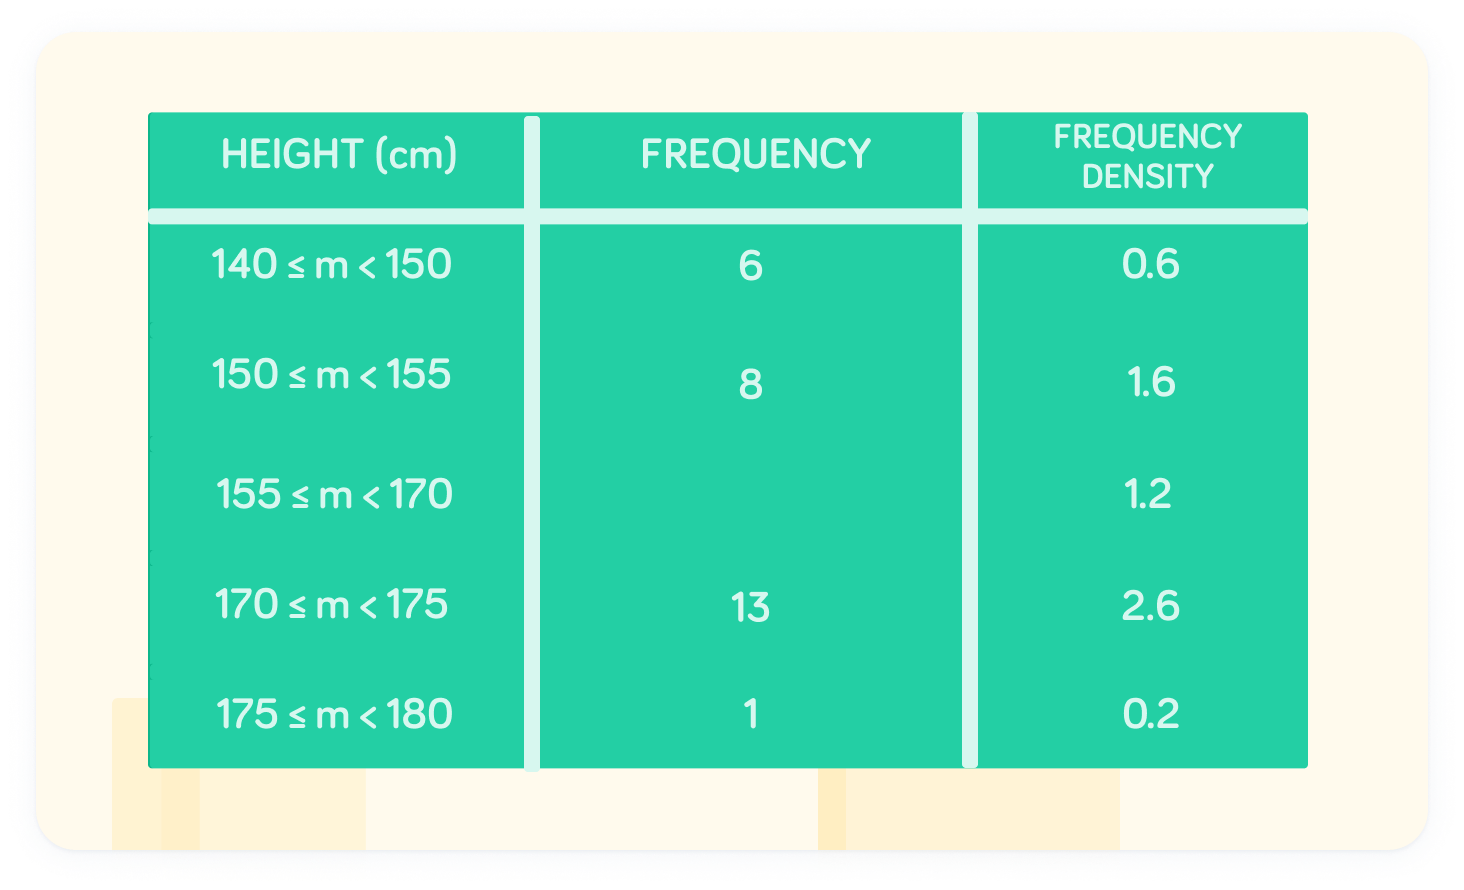
What is the frequency at the interval ?
The frequency is 18 at the interval
The cumulative frequency can identify the median
We need to identify which interval the median value is located in.
What is the missing cumulative frequency value?
The median is the 23rd value
Therefore, we can see that it is located in the interval . The 23rd student, therefore, has a height between 155cm and 170cm.
We can represent this on a number line
The number line presents a schematic showing where the median lies relative to the upper and lower bounds of the interval.
Now we can identify a proportional relationship
The proportion of the position of the median is the same as the proportion of the value of the median (relative to the upper and lower bounds of the interval):
We can simplify this equation
\dfrac{23-14}{32-14}=\dfrac{Q2-155}{170-155} \space \rightarrow \space $$\frac{9}{18}=\frac{Q2-155}{15}
By rearranging, we can find the median
If , what is ?
The median is
Great work! Remember this is only an estimate, since we cannot observe the median directly in grouped intervals.