YOU ARE LEARNING:
Histograms: Finding the Frequency

Histograms: Finding the Frequency
We can work backwards from histograms to find the frequency of a given interval.
We can work backwards from a histogram to infer information and data.
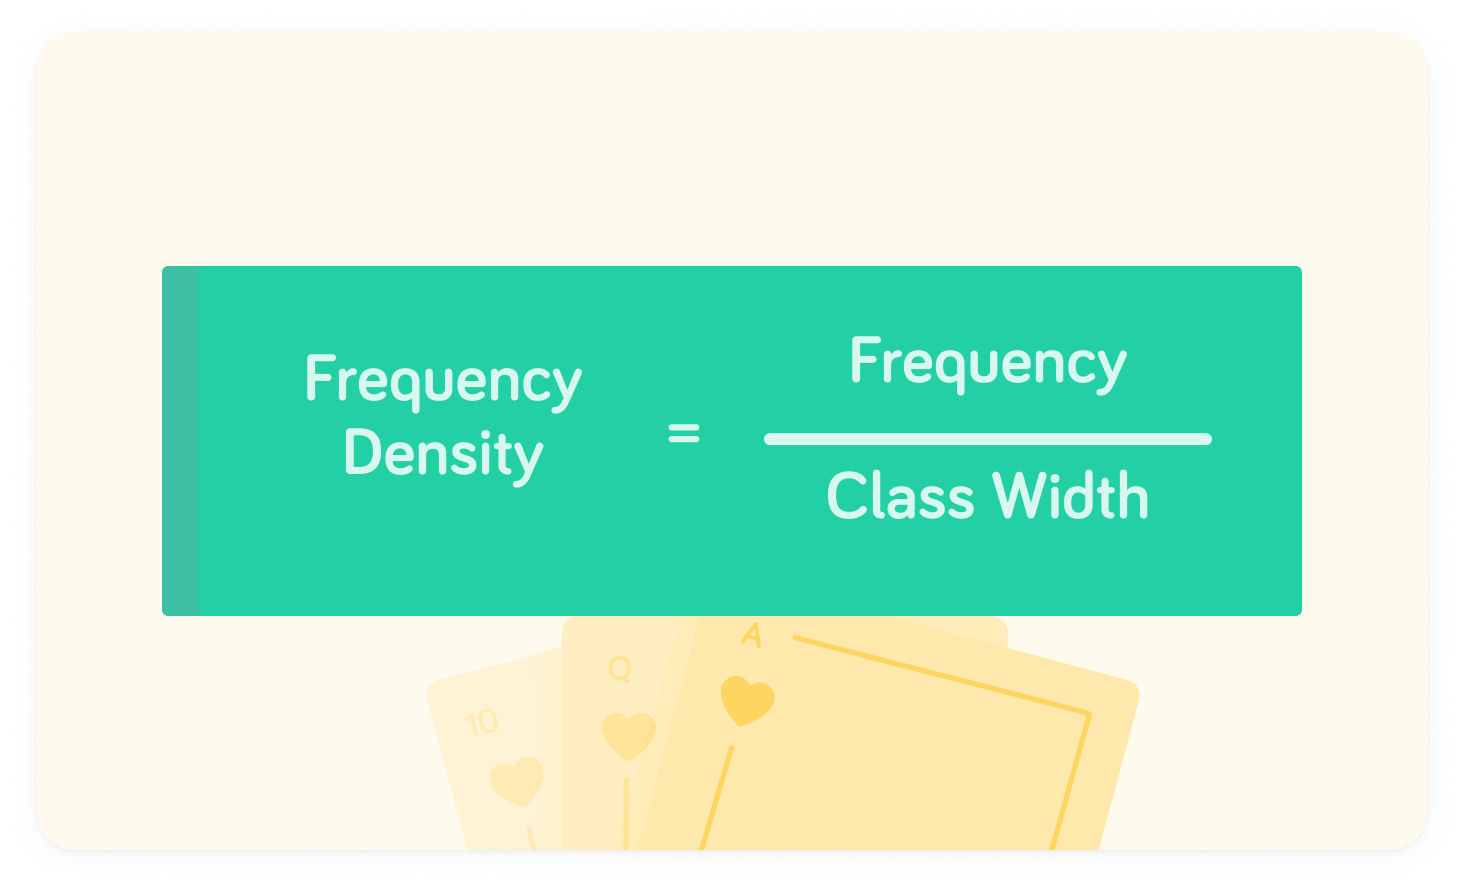
Which is the correct formula for finding the frequency density?

Remember the formula for frequency density
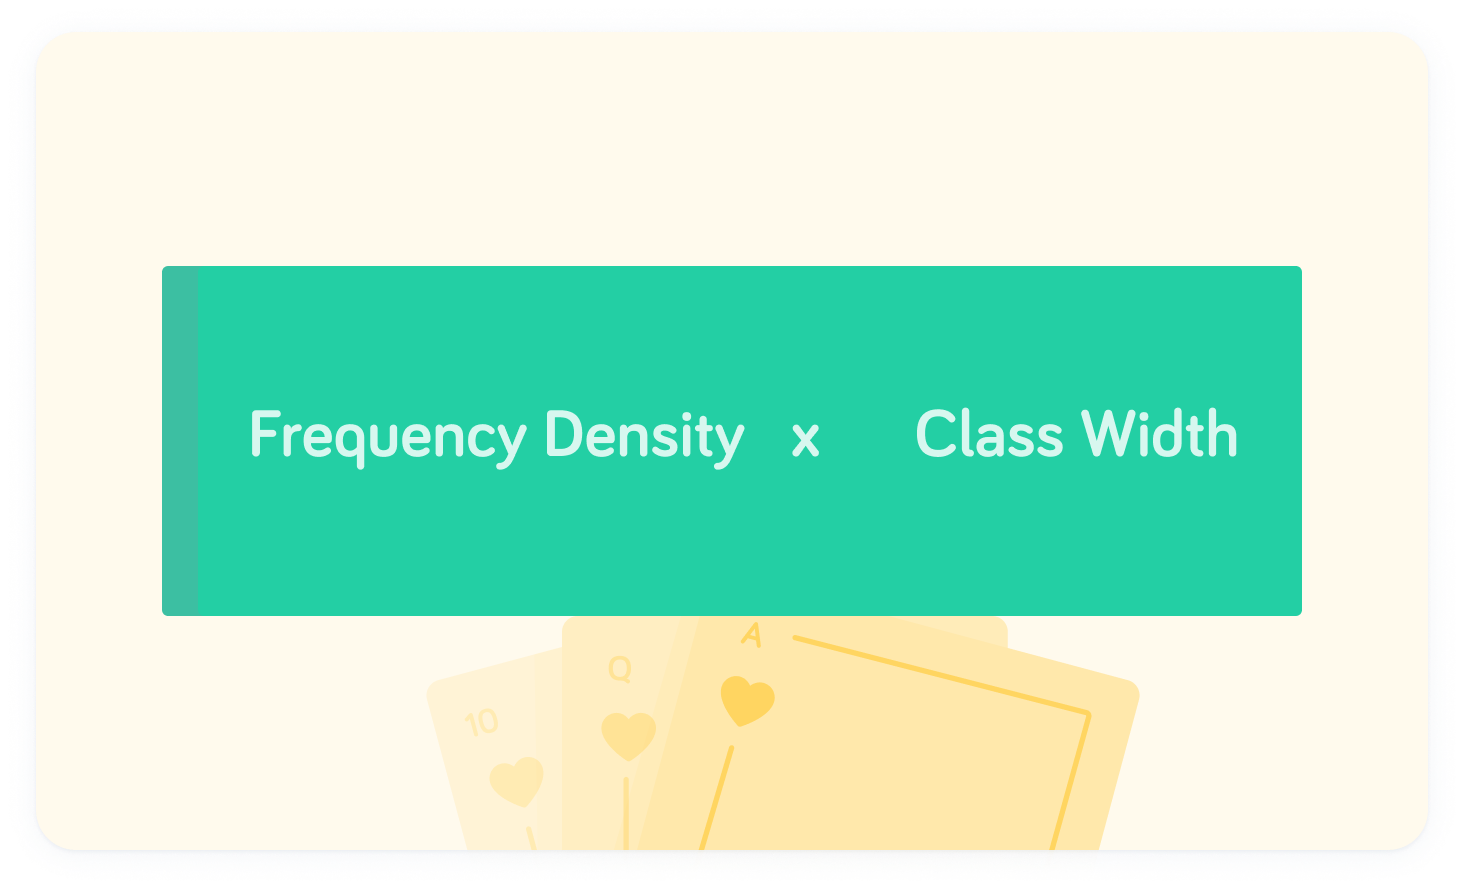
When we have a histogram, or are already given the frequency density, we can rearrange this formula to give us the frequency.
By rearranging, we find this formula
This is useful because frequency is raw data which we can draw insight from if it is not initially provided.
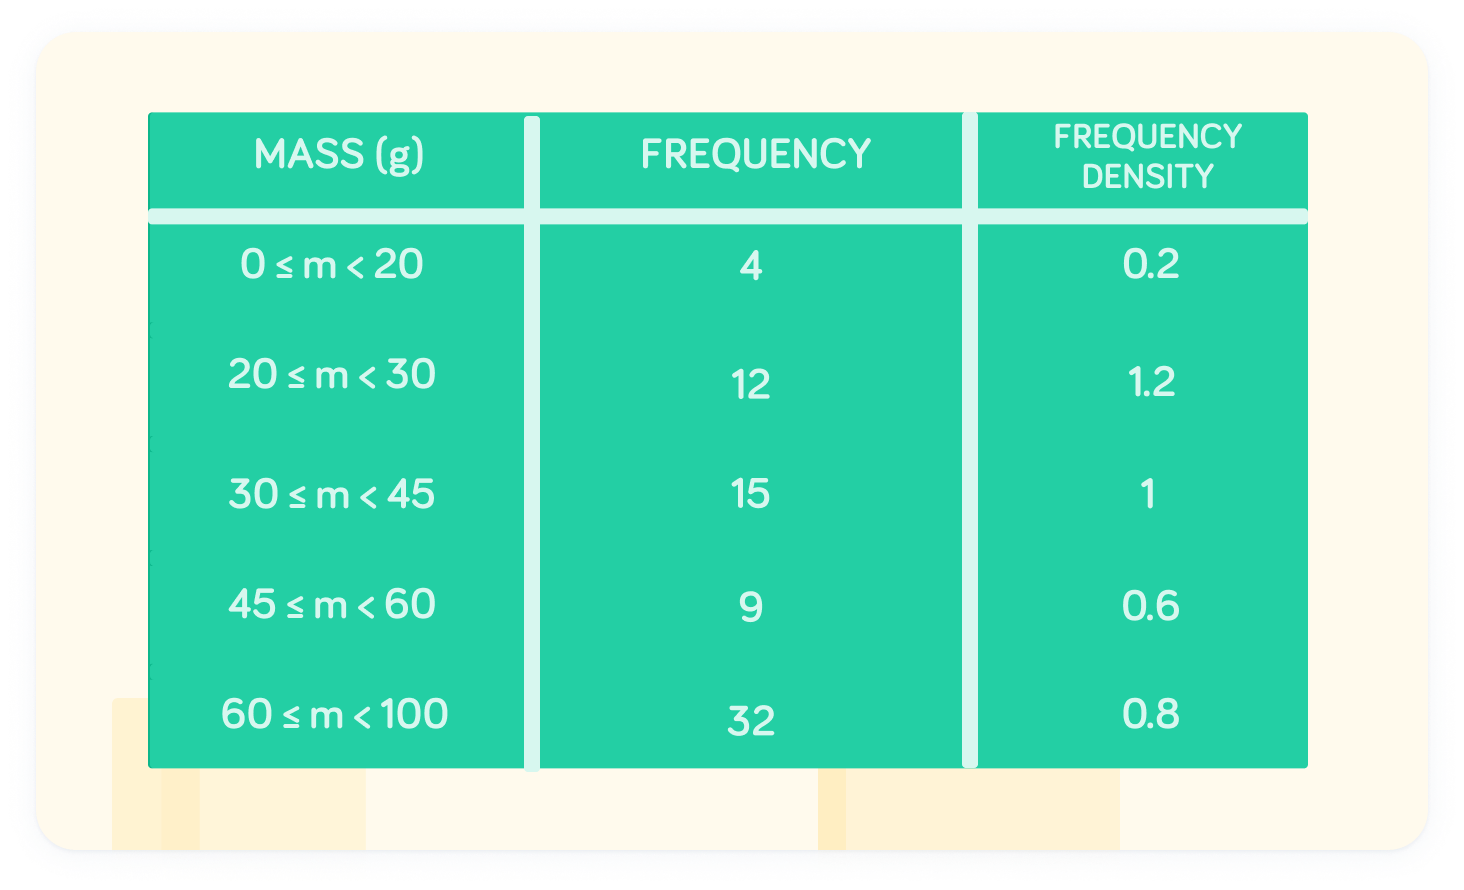
This table describes the histogram
We have the frequency densities already, so can apply our formula to find the frequency.

At , the frequency is 4
The frequency density is 0.2 and the class width is 20. Therefore . There must have been 4 fruits between the mass of 0 and 20 grams.
What was the frequency at the interval
The frequency at is 12
The frequency density is 1.2, while the class width is 10. Therefore,
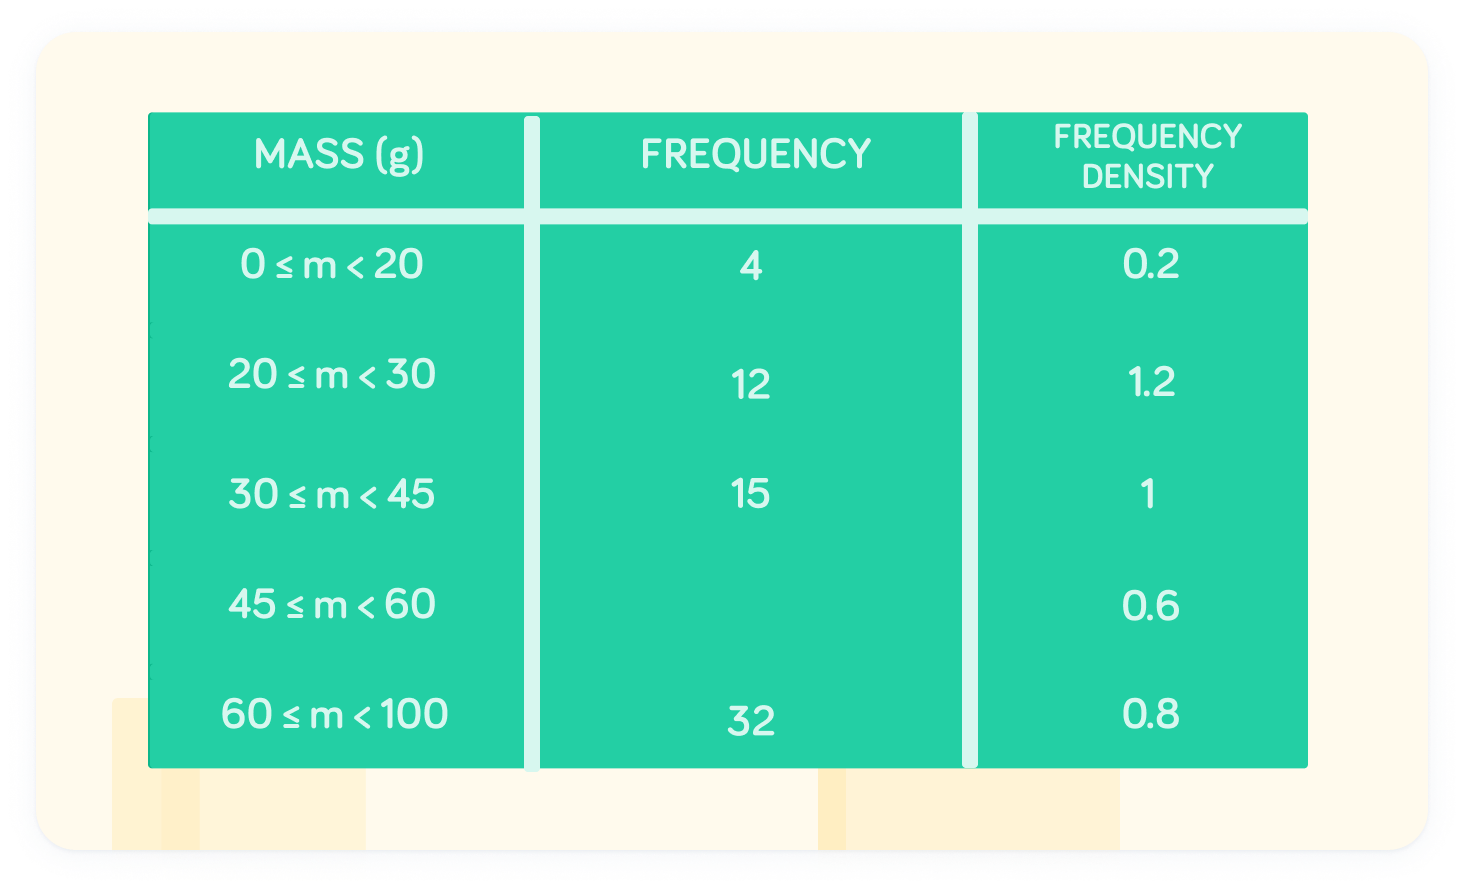
What is the frequency at the interval
The frequency at is 9
The frequency density is 0.6, while the class width is 15. Therefore,