YOU ARE LEARNING:
Cumulative Frequency Diagrams

Cumulative Frequency Diagrams
Cumulative frequency diagrams are a visual way to represent the running total of items or values.
Cumulative frequency diagrams are used to represent a “running total” of items or values. They are particularly useful for estimating values such as the median or interquartile range from data collected in group intervals.
Cumulative frequency is a measure of...

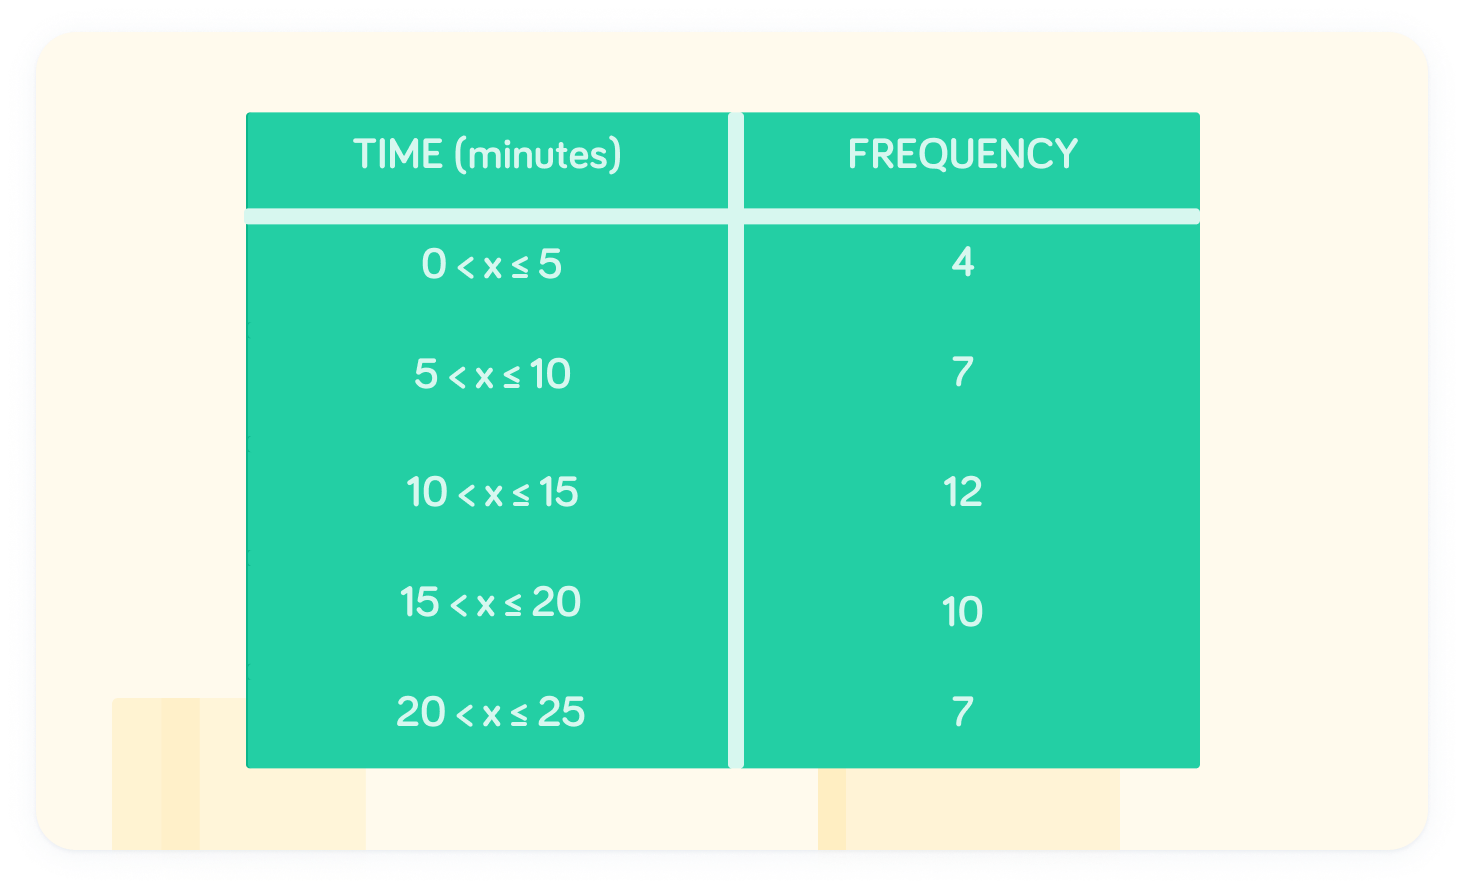
A group of 40 students take part in a jigsaw puzzle competition
Information on the time it took for students to complete a puzzle is given in the table.
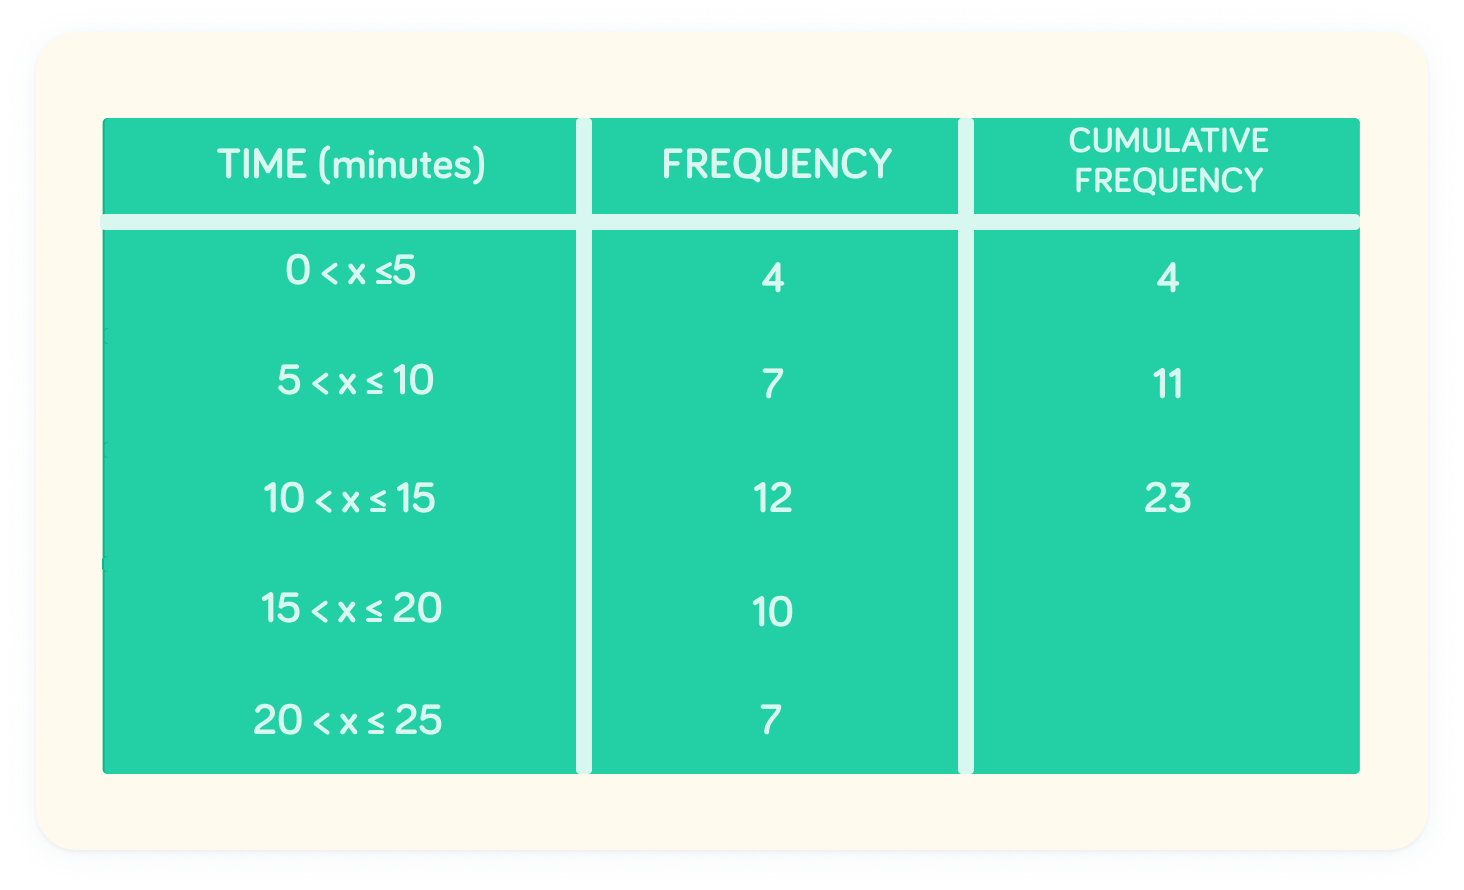
Before drawing a diagram, we should work out the cumulative frequency
The cumulative frequency can be found by adding together the current frequency and each of the previous frequency values.
We can see some cumulative frequencies filled out in the table
For the interval , the cumulative frequency is . Similarly, at , the cumulative frequency is .
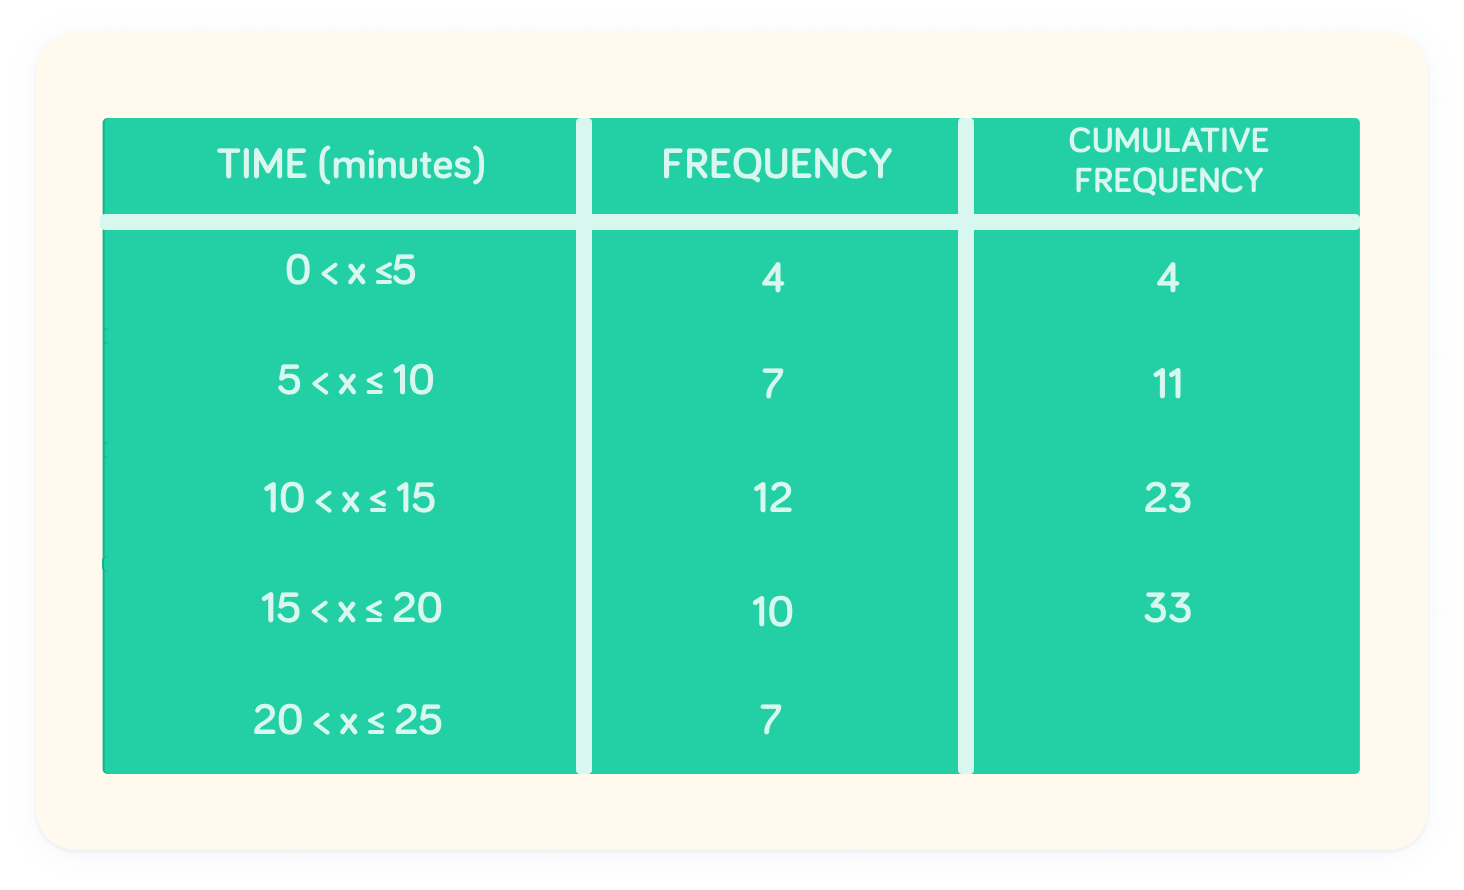
What is the cumulative frequency for ?
The cumulative frequency at is 33
We can add 10 onto the previous cumulative frequency value: .
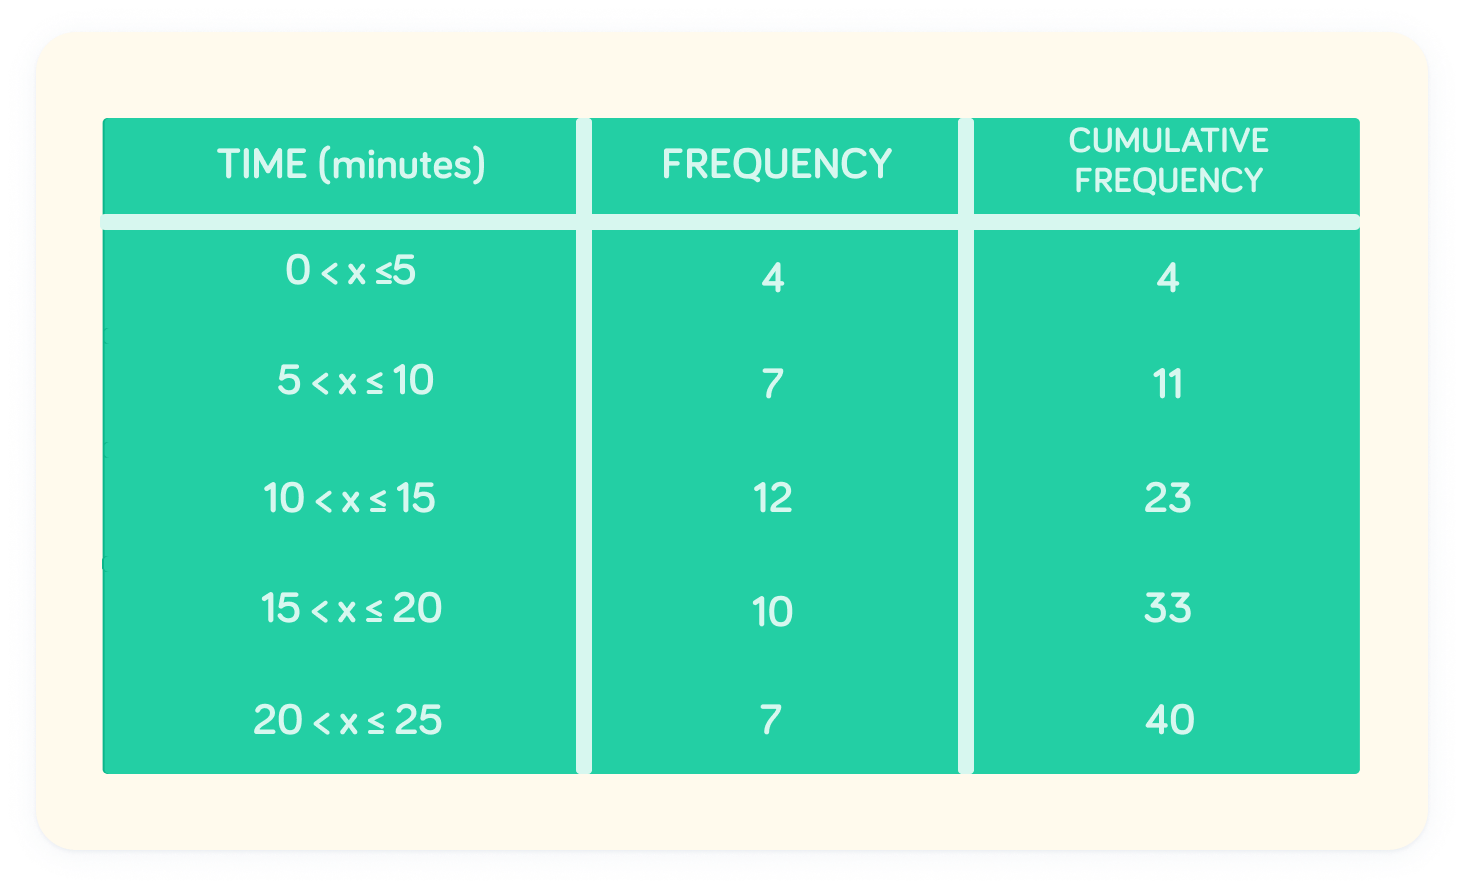
What is the cumulative frequency at ?
At , the cumulative frequency is 40
We add 7 to the previous cumulative frequency value:
To translate this to a diagram, we need to generate points
On our cumulative frequency diagram, we will plot the cumulative frequency on the y-axis and the time taken along the x-axis.
To generate coordinates, use the upper bound of each interval
For the interval , the upper bound of the interval is 5, while the cumulative frequency is 4. Therefore, the coordinate is . We can see this repeated for the other two coordinates.
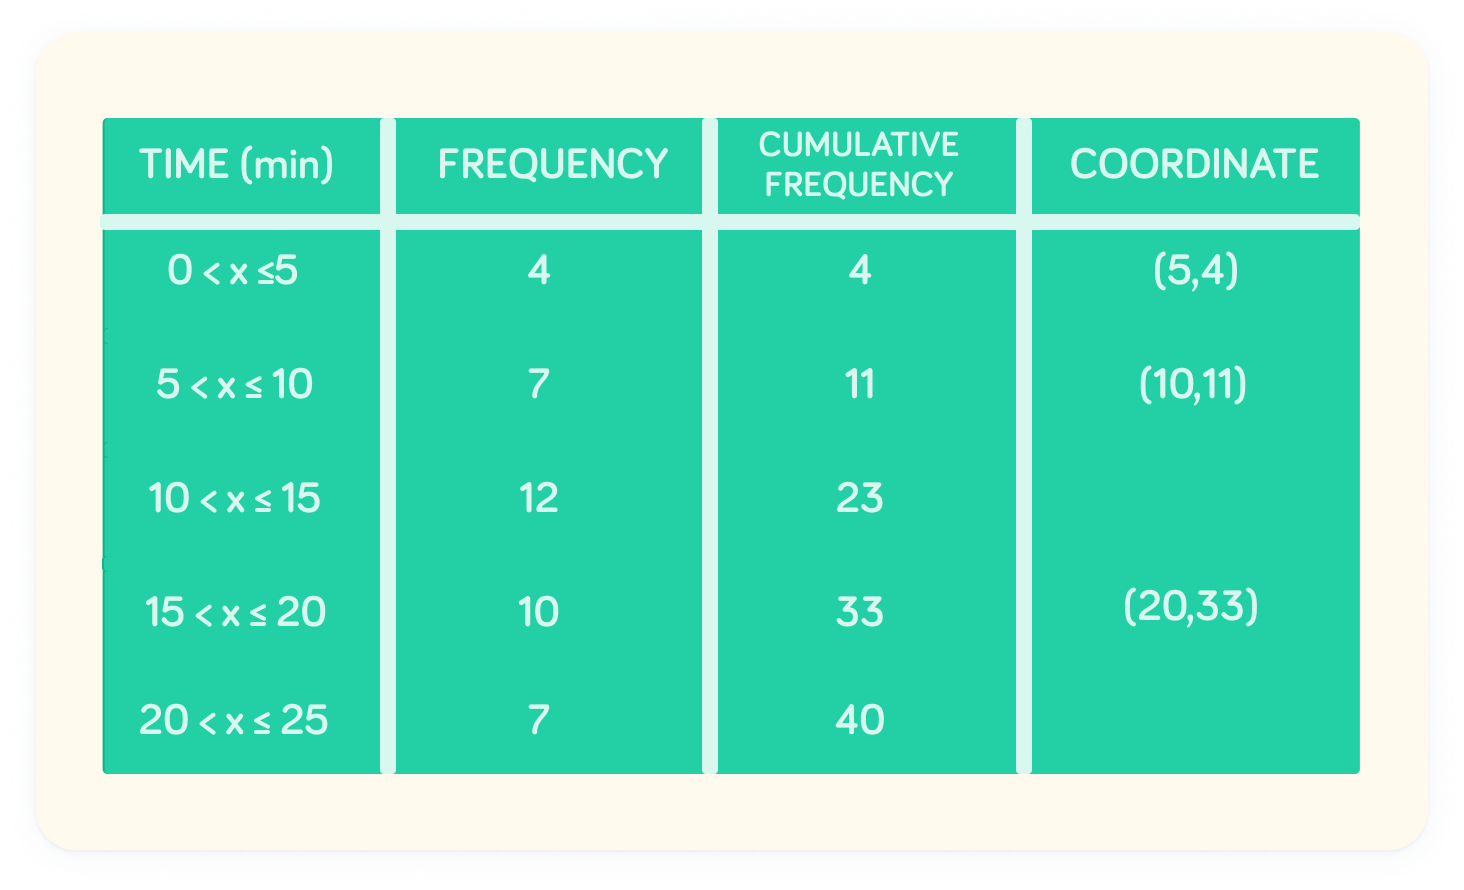
What is the coordinate for the interval ?
The coordinate should be
The upper bound of the interval is 25 (x-coordinate), while the cumulative frequency is 40 (y-coordinate).
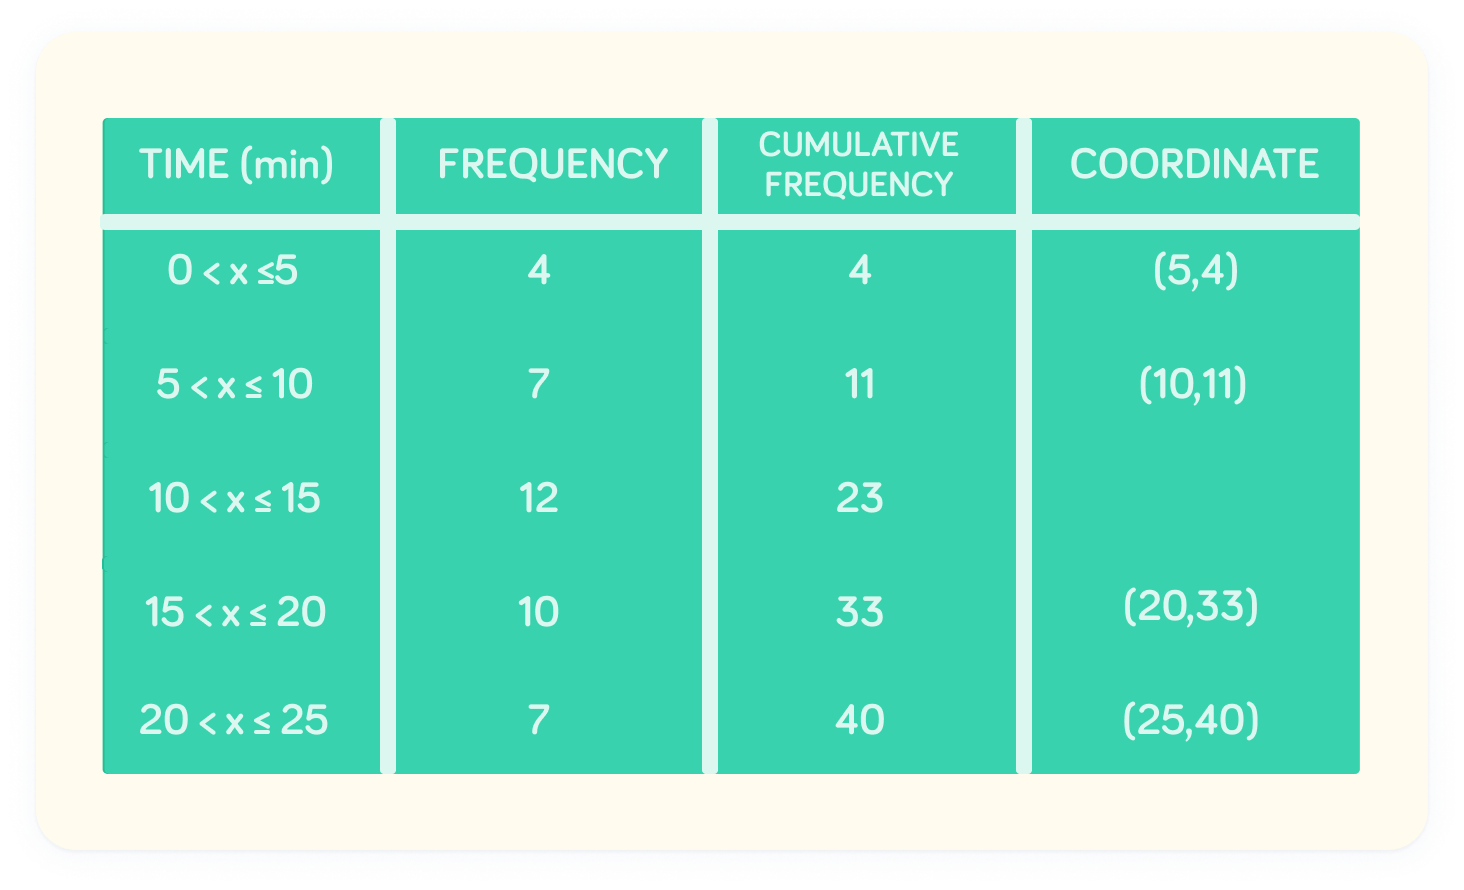
What is the coordinate for the interval ?
The coordinate should be
The upper bound of the interval is 15 (x-coordinate), while the cumulative frequency is 23 (x-coordinate).
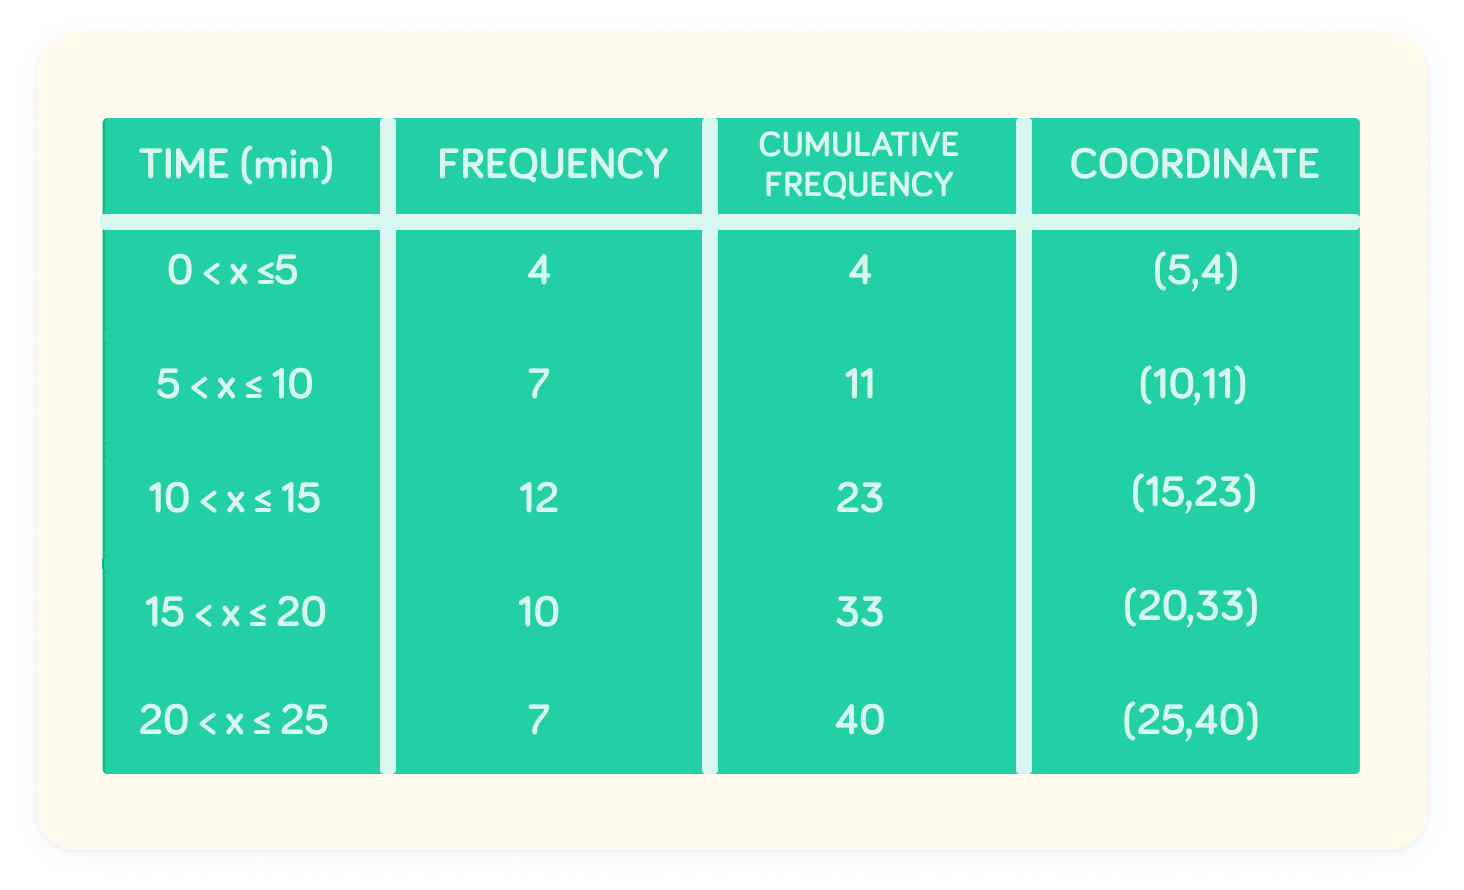
When drawing a cumulative frequency table from a dataset containing intervals, the x-coordinate for the interval should be the...