YOU ARE LEARNING:
Two-Way Tables
Two-Way Tables
Two-way tables display data with more than one category and multiple sub-groups into a format which is easy to read.
Two-way tables allow us to organise data with more than one category and multiple sub-groups into a format which is easy to read.
Data is often collected in more than one category. When collecting data on students at a school, we might be interested in their year group, their favourite subject AND their favourite sport.
Some data is collected on a group of students
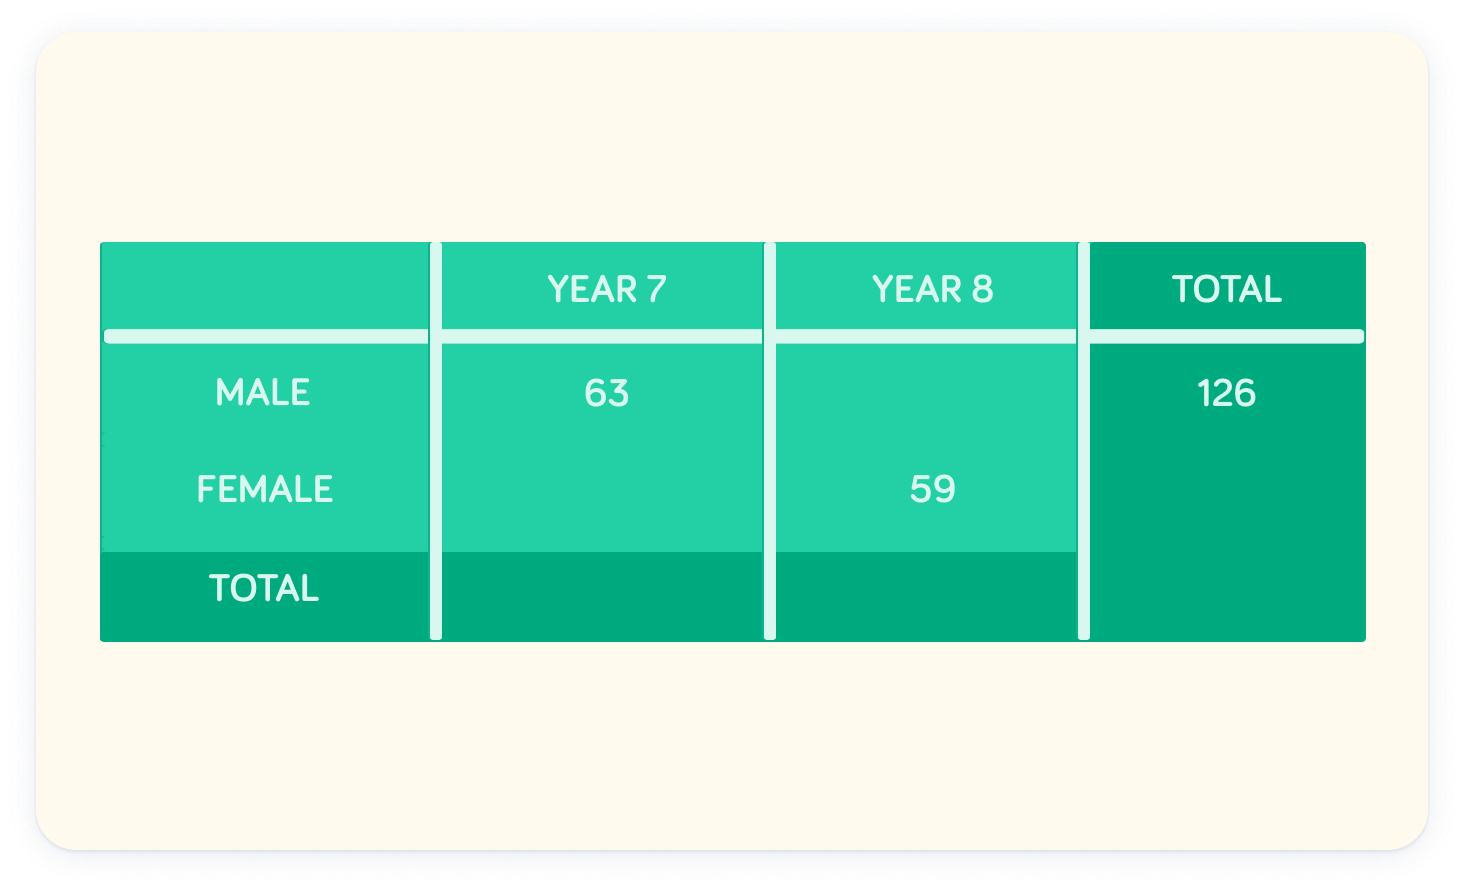
There are 63 boys in Year 7, 59 girls in Year 8, 126 boys in Year 7 and Year 8, and 178 pupils in Year 7.
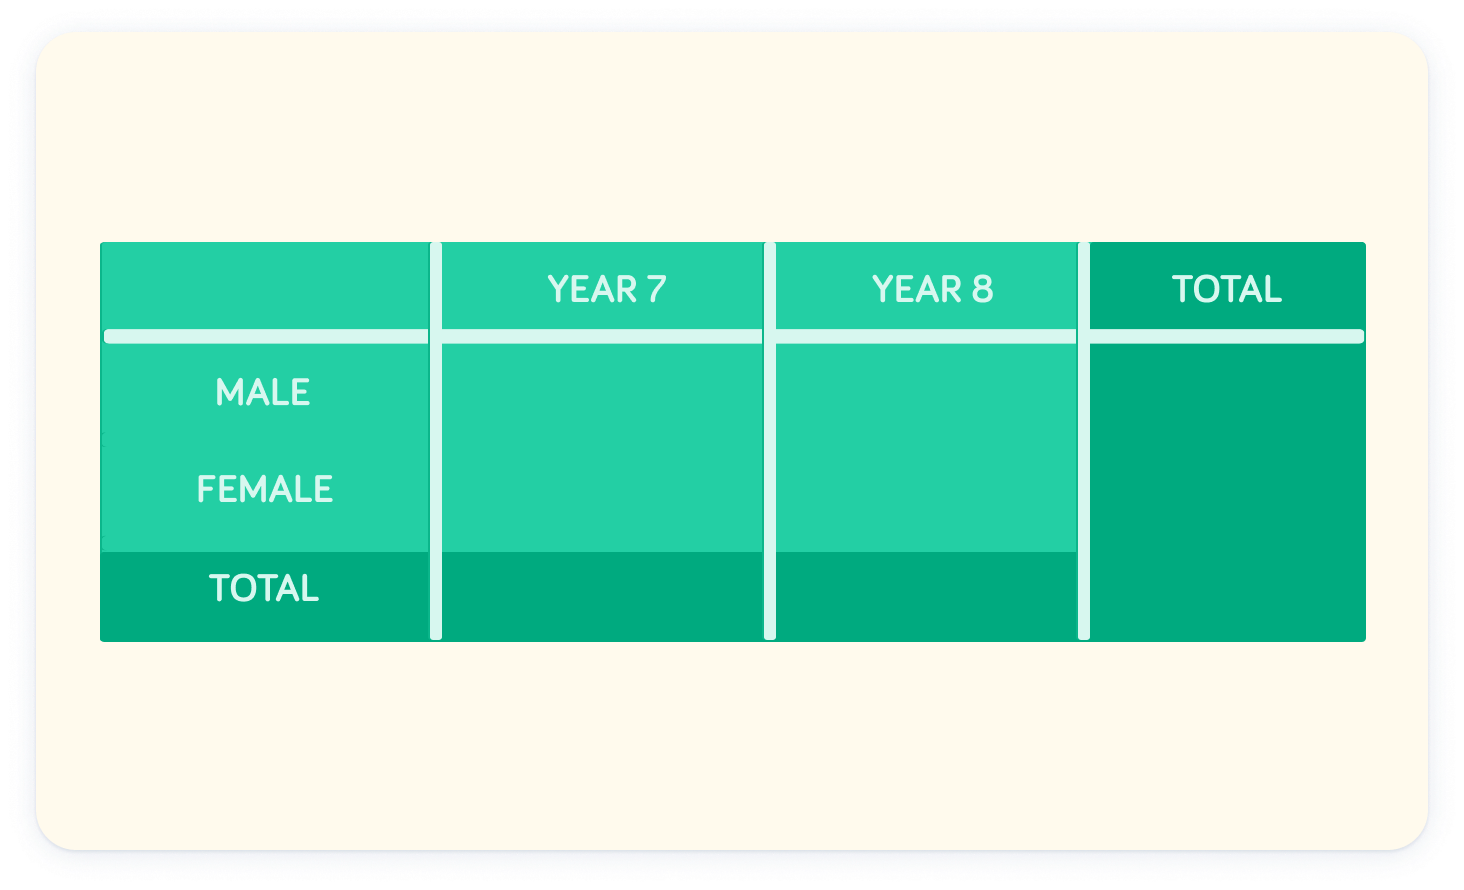
There are two categories to split data into
We have information on gender, and also year-group. Therefore, a two-way table is a neat format to use.

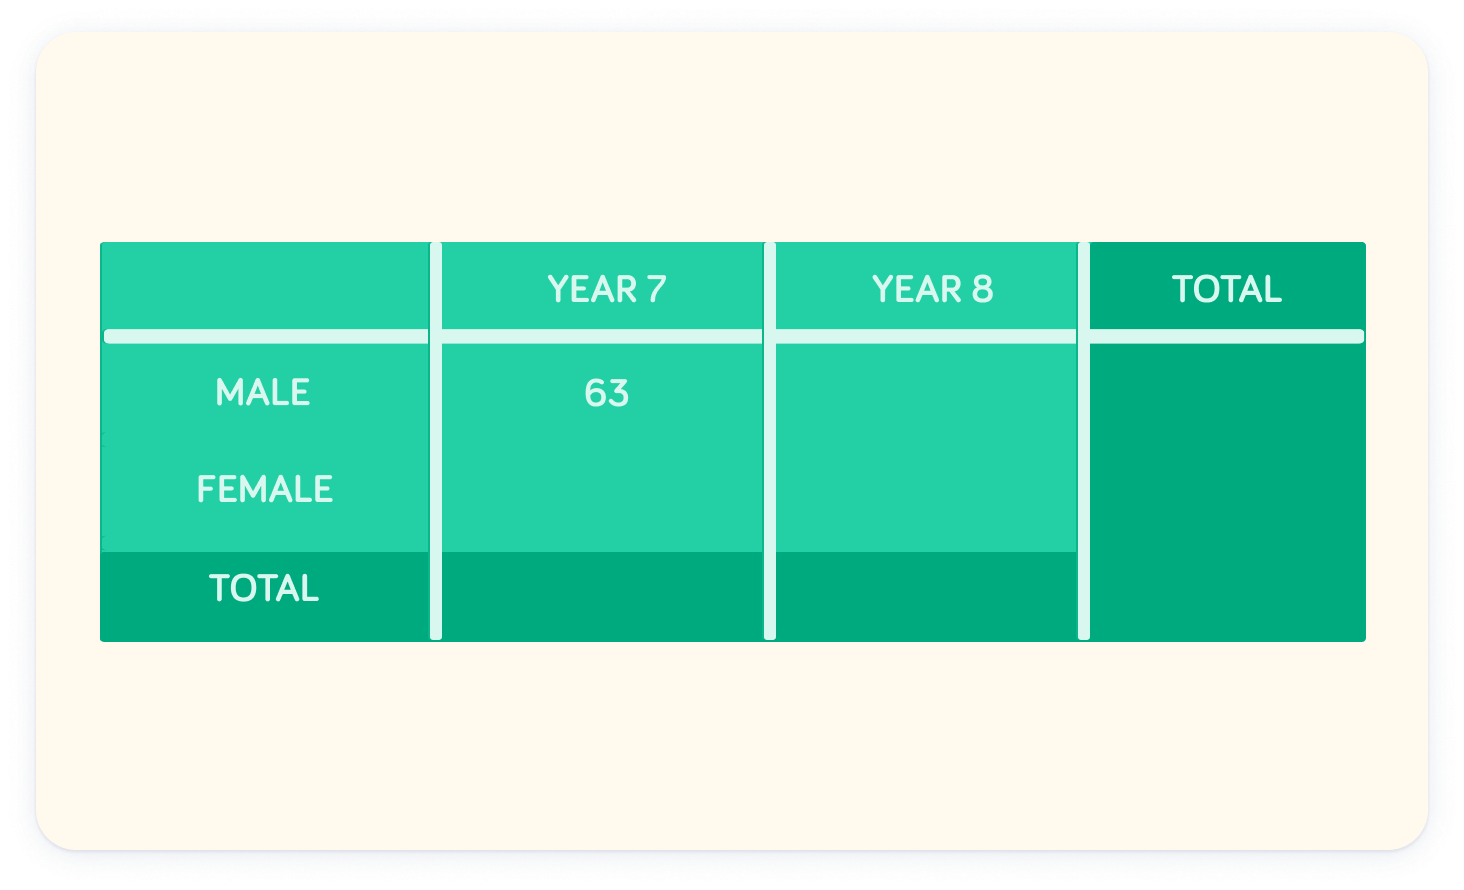
We can add in the values we know
There are 63 boys in year 7. This number goes in the "Male" row and "Year 7" column.
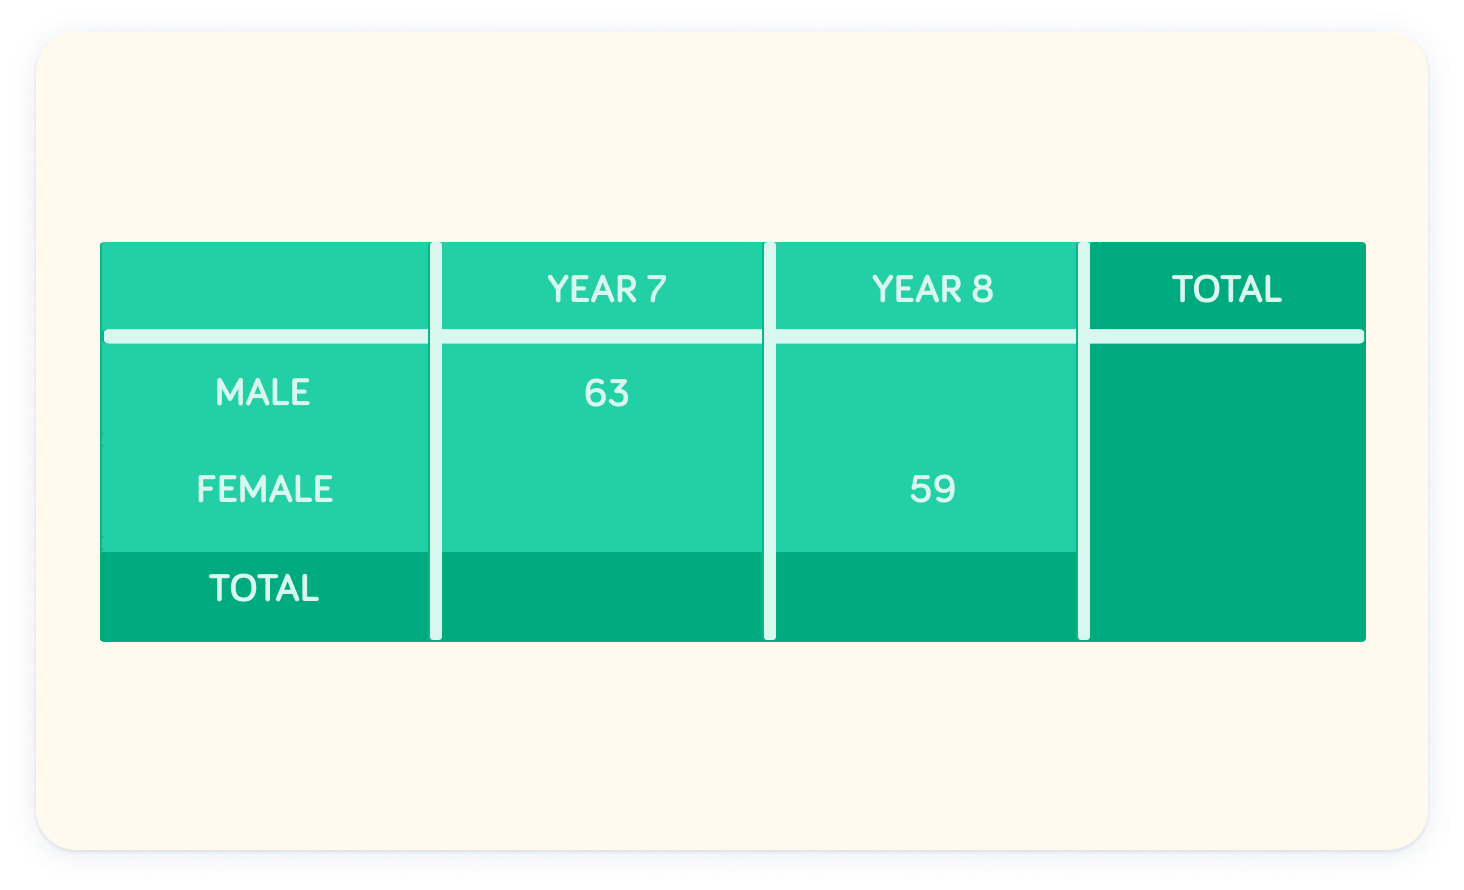
There are 59 girls in Year 8
There are 126 boys in Year 7 and Year 8
Therefore, the total number of boys is 126.
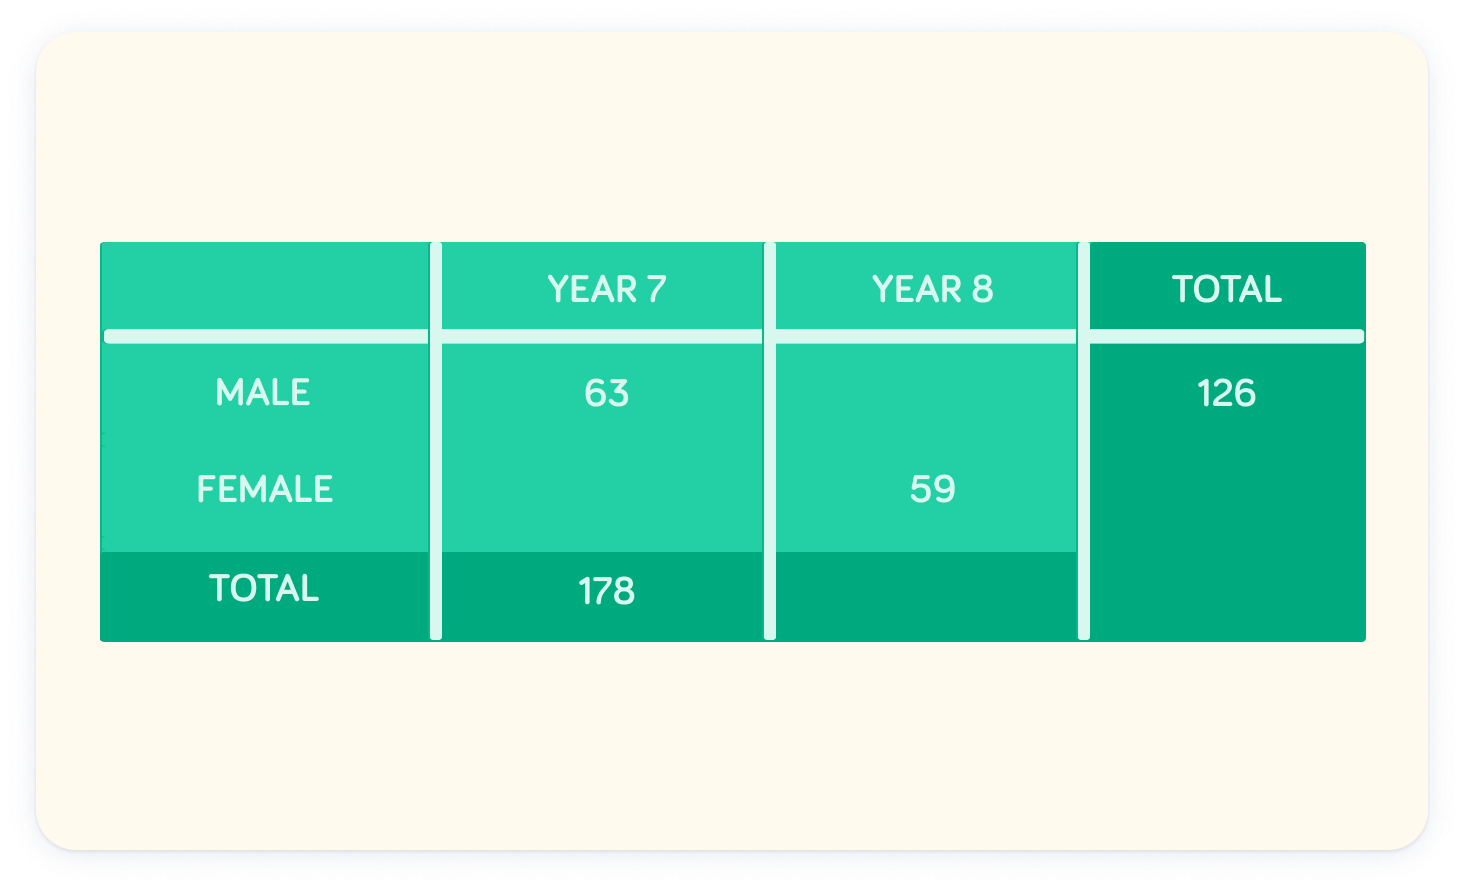
There are 178 pupils in Year 7
This means that we can fill out the "Total" for Year 7 pupils as 178.
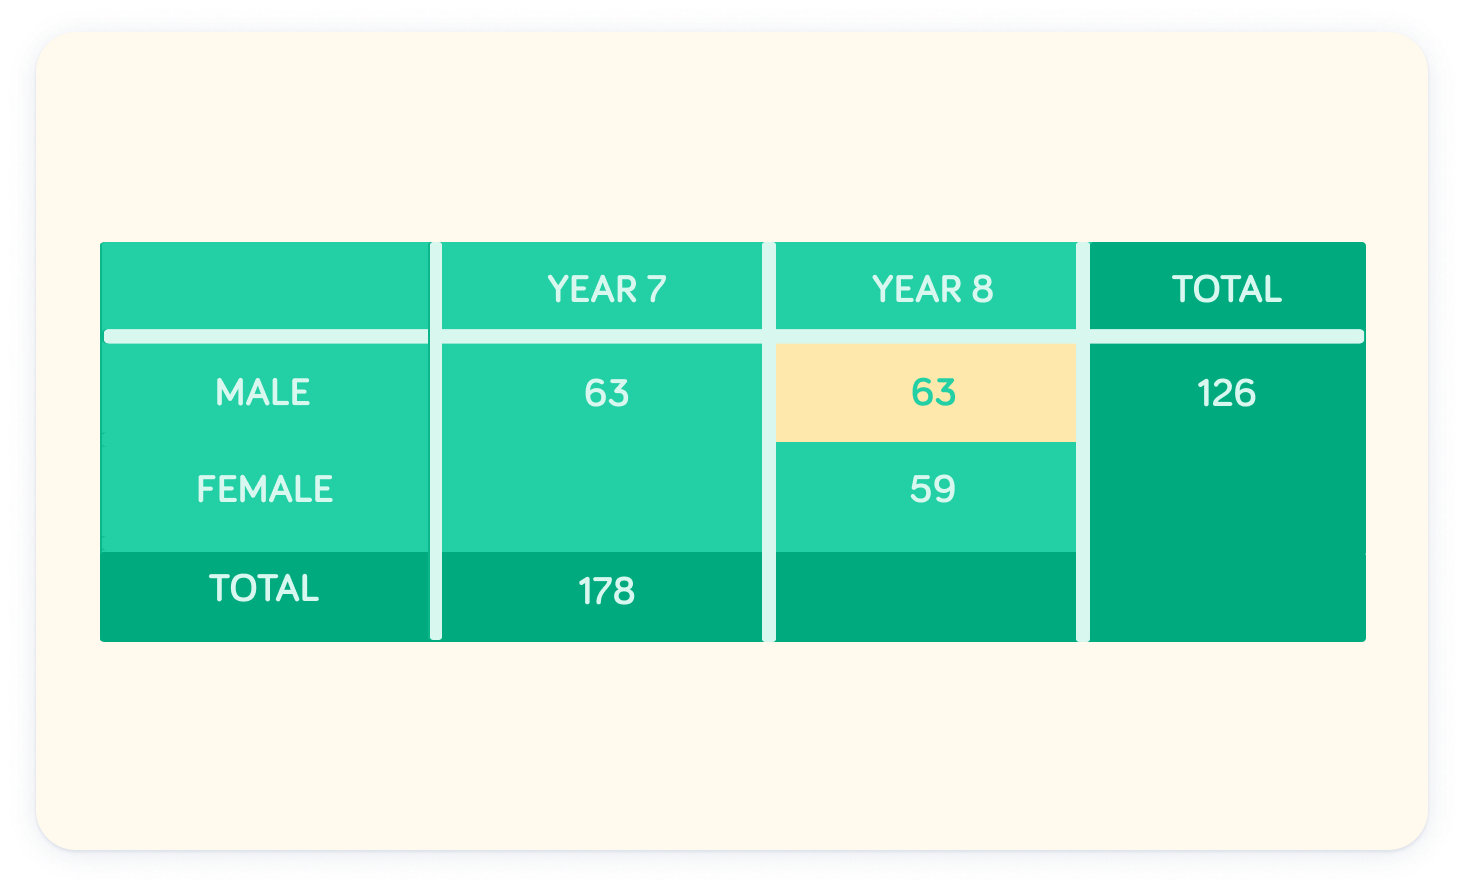
How many male students are in Year 8?


There are 63 male students in year 8
There are 126 total male students, so 126−63=63
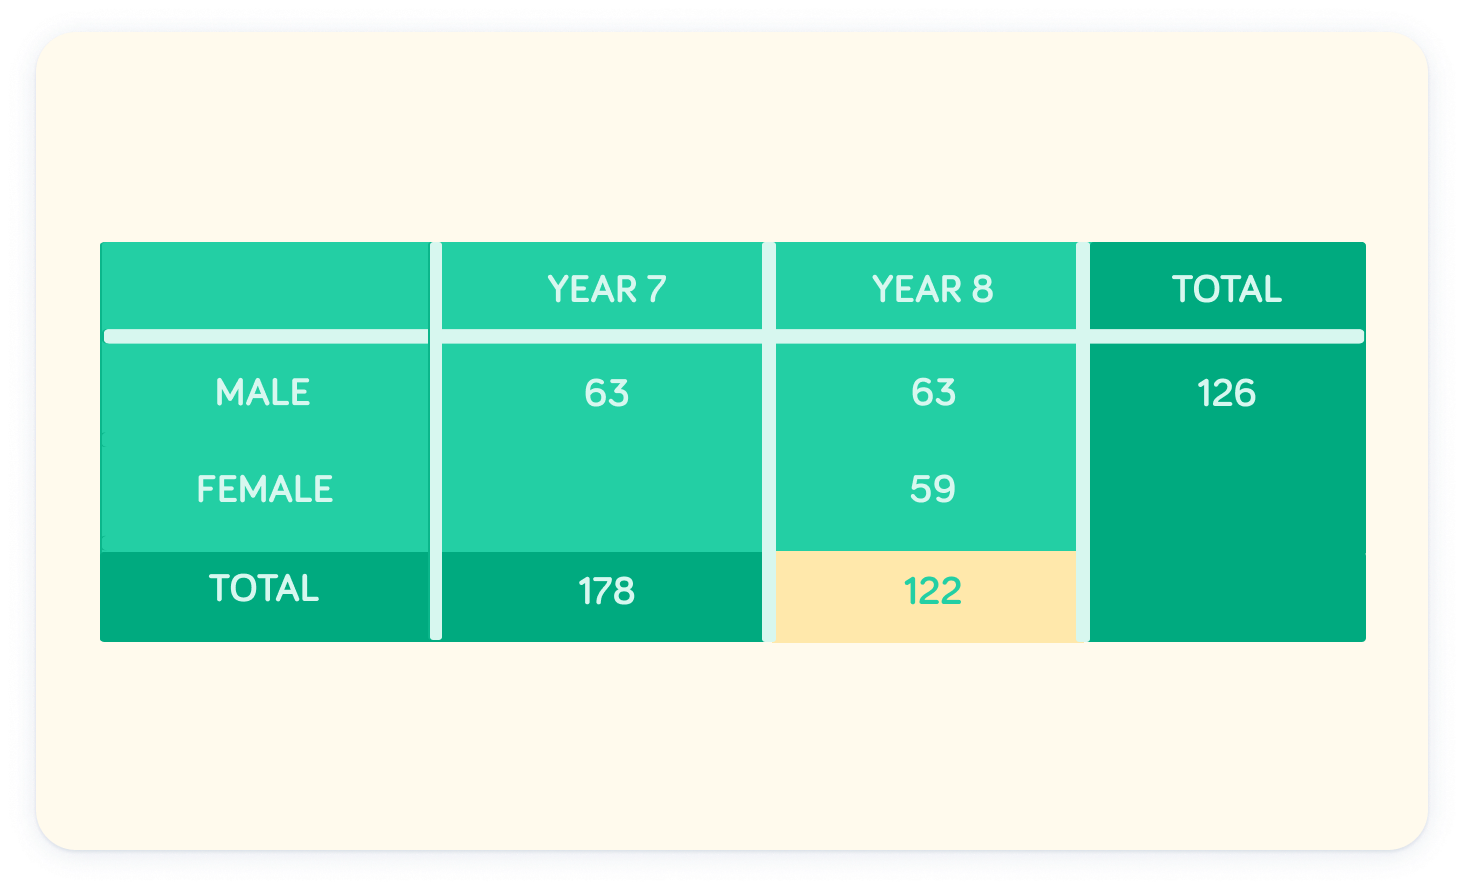
How many students are in year 8 in total?


There are 122 total students in Year 8
By adding together the male and female students in Year 8, we find 63+59=122
How many female students in Year 7?


There are 115 female students in Year 7
There are 178 total students in year 7, and 63 boys. Therefore: 178−63=115
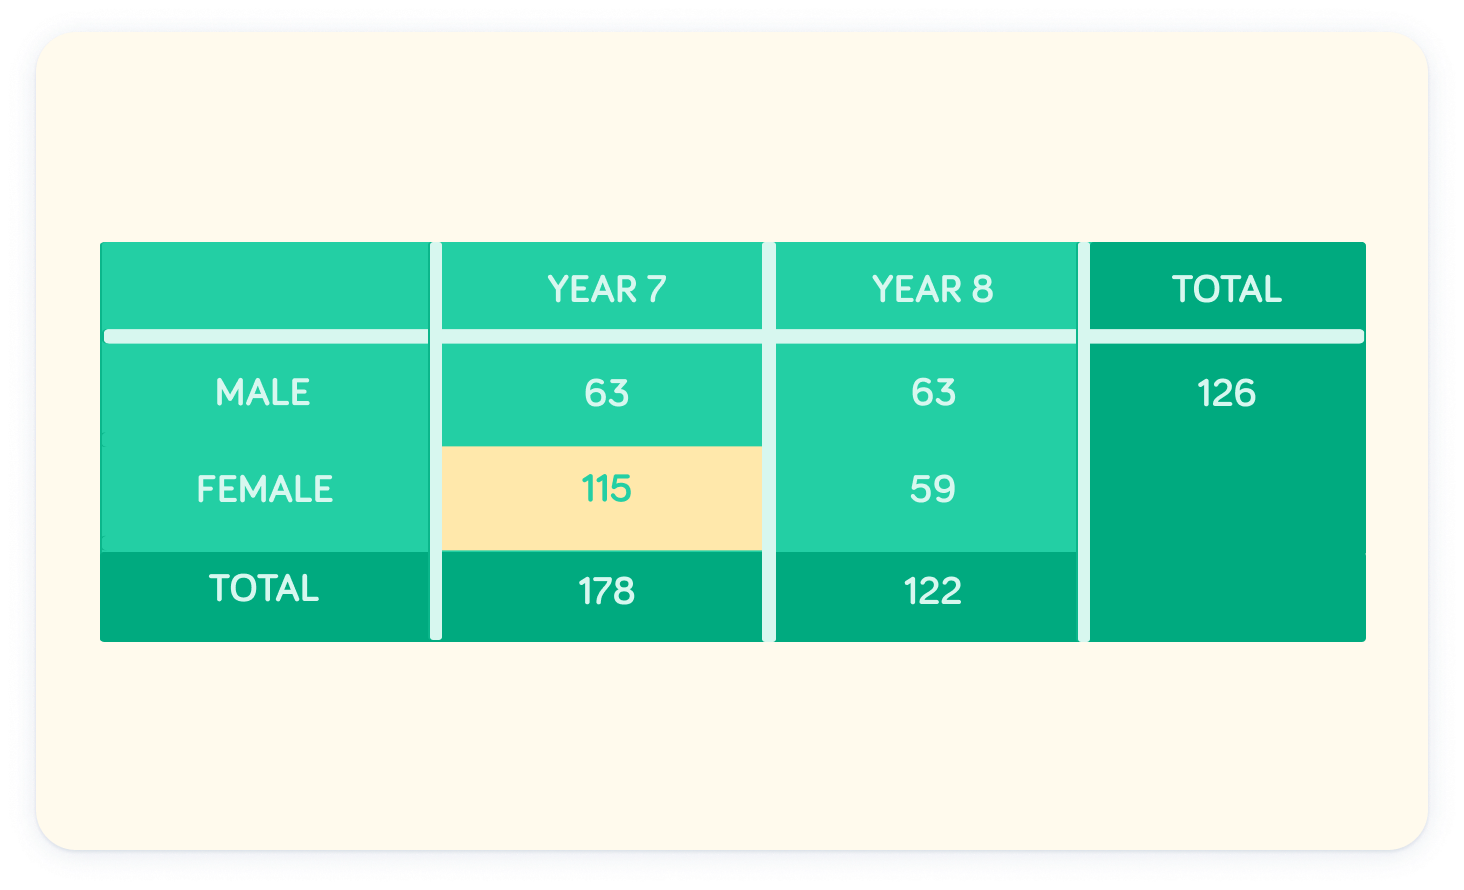
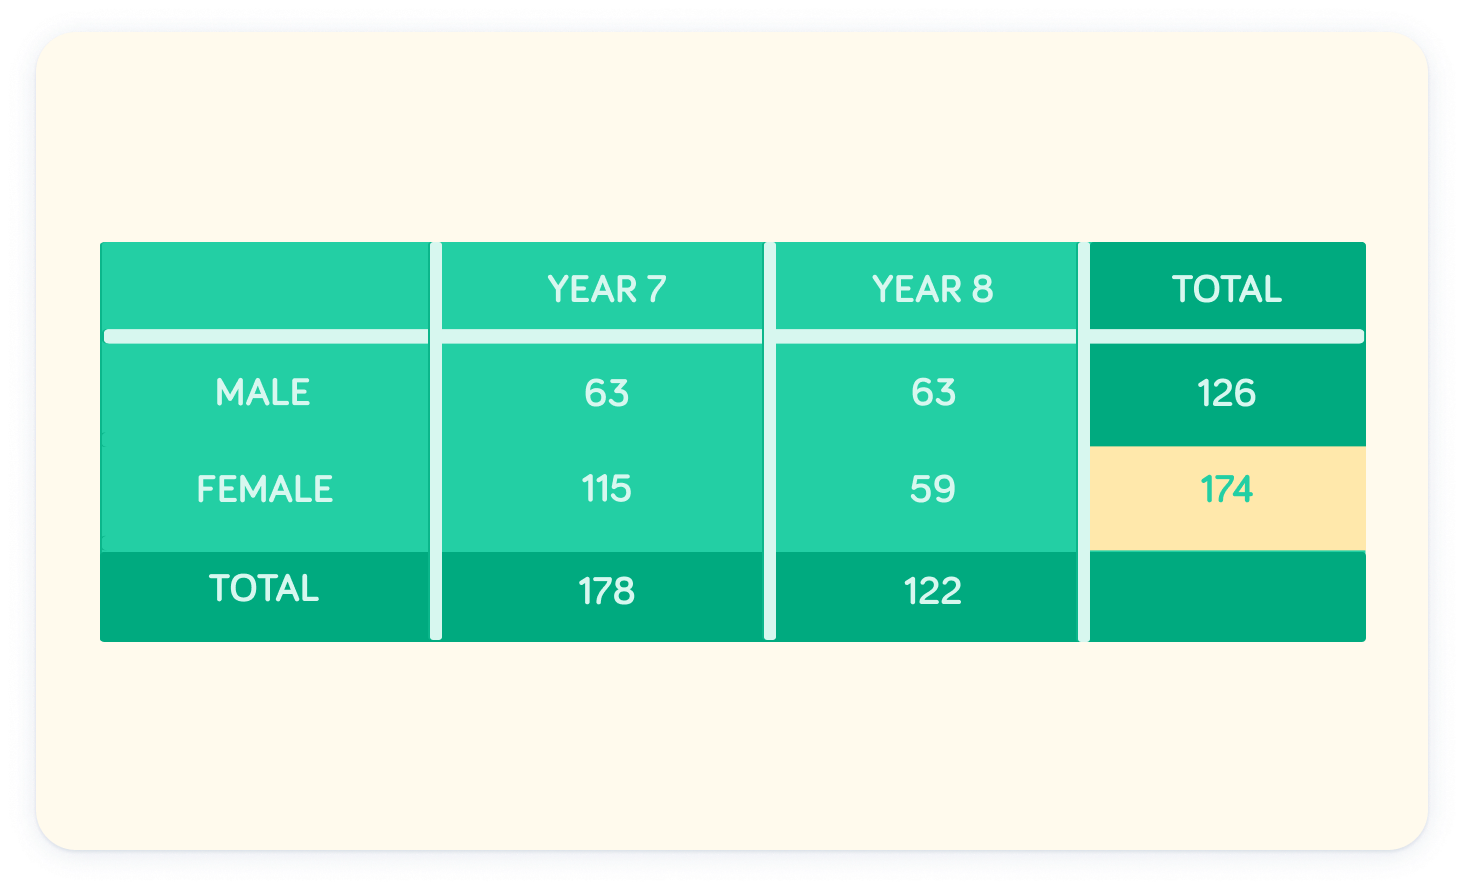
How many female students are there in total?


There are 174 female students in total
Reading across the table: 115+59=174
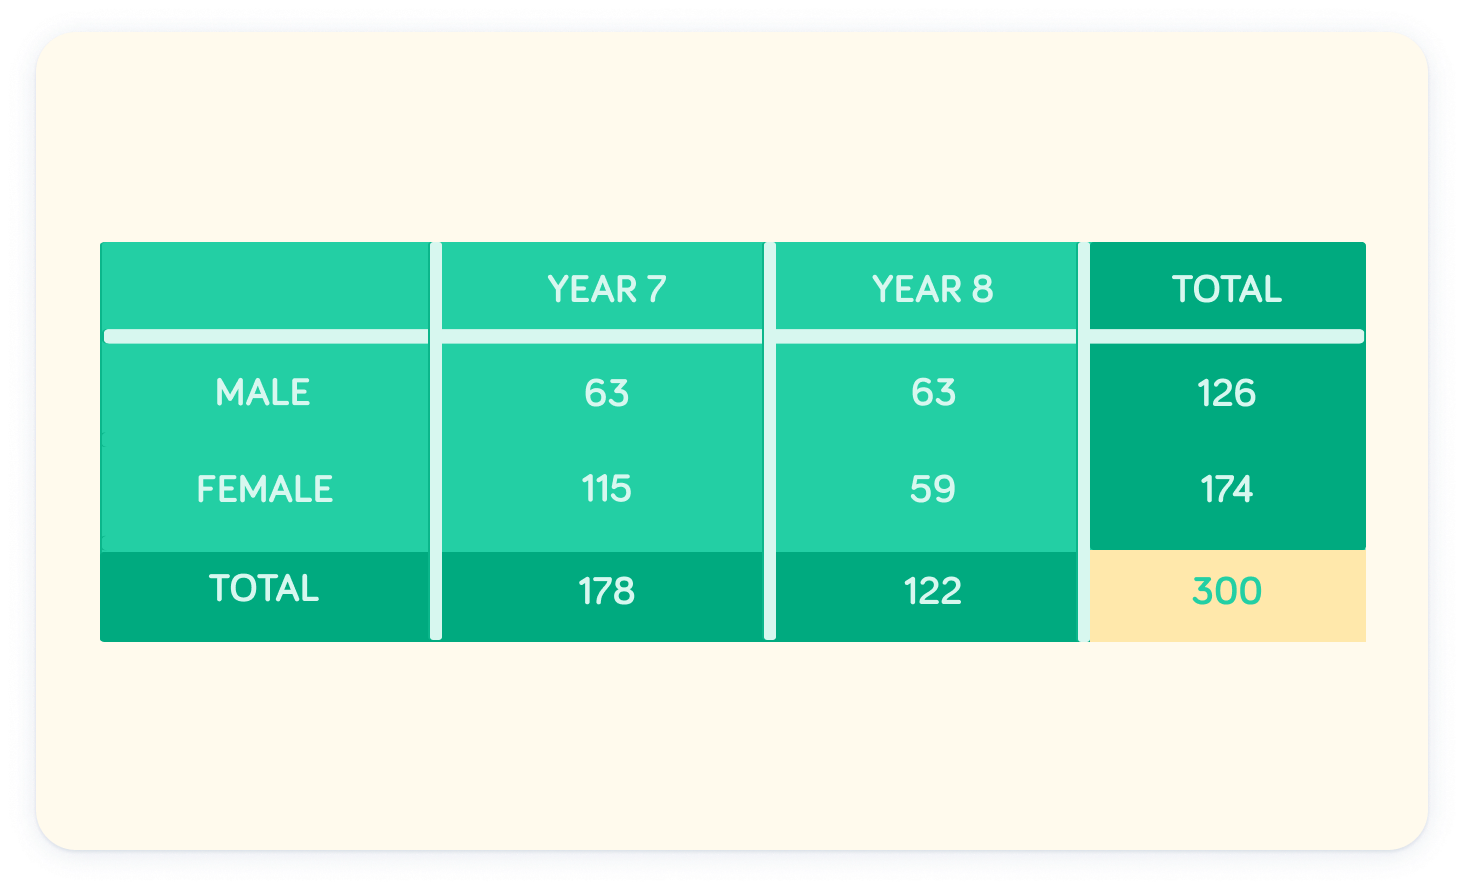
So, how many students are there in total?


There are 300 students in total
Notice that both the total column and the total row add up to 300.
Data is collected on the heights of 6 male cyclists. Would a two-way table be appropriate for displaying this data?

