YOU ARE LEARNING:
Stem and Leaf Diagrams

Stem and Leaf Diagrams
Stem and leaf diagrams enable us to collect raw data in a format which is fast and easy to read.
When collecting data, we may end up with lots of values that are hard to process in one go. A stem and leaf diagram is a method of clearly and quickly displaying data.
A stem and leaf diagram splits numerical values into stems and leaves. For example, the stem of 14 would be 1, while the leaf would be 4.
Which digit in a number is considered the leaf?

You've collected information on 15 people's weight
The values are
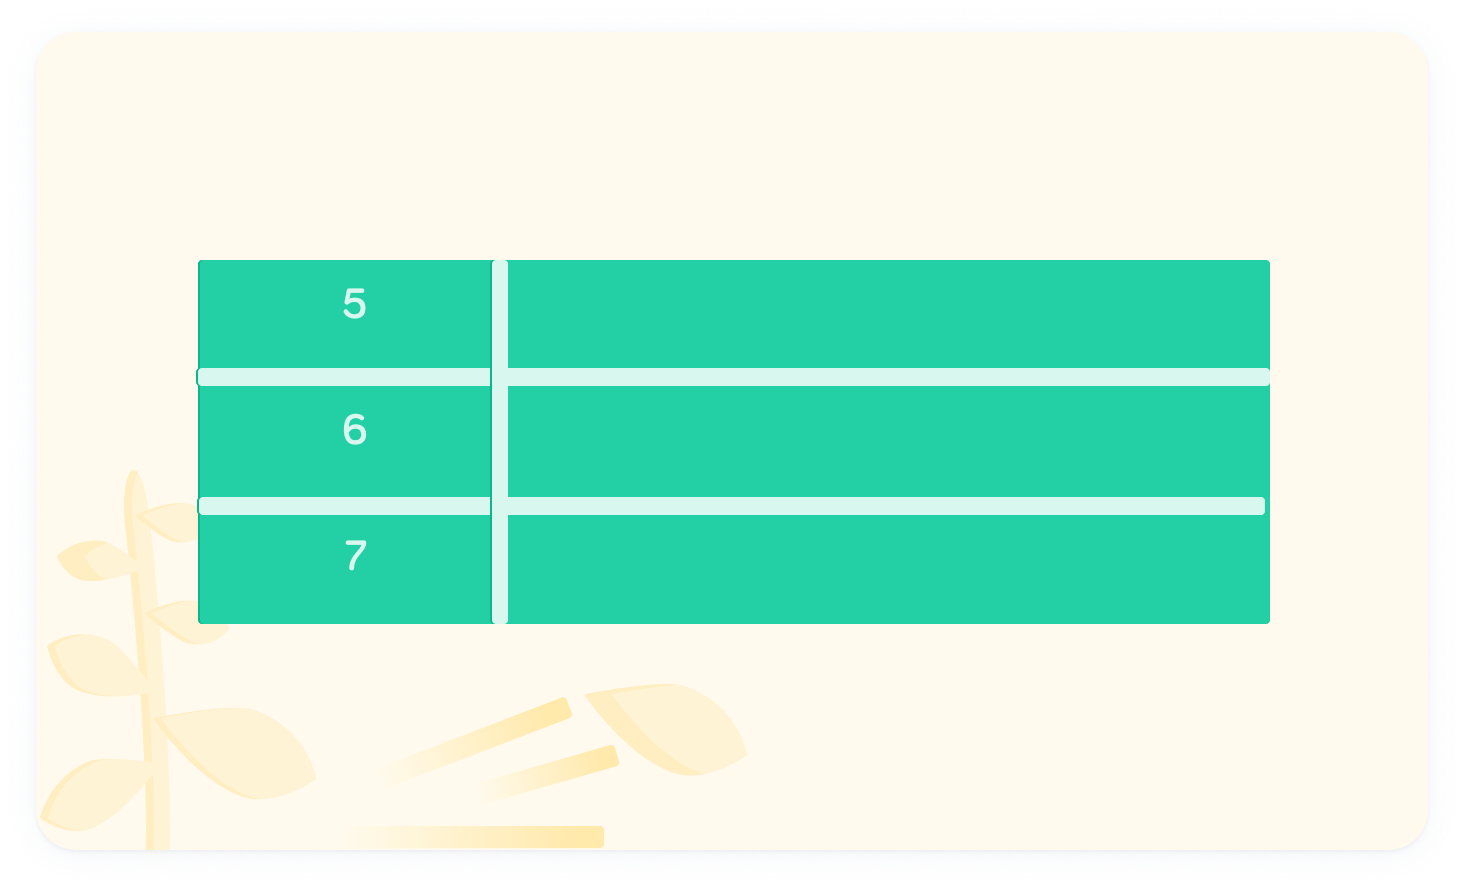
The stems are 5, 6 and 7
The stems represent 50, 60 and 70. These go on the left side of the table.
What would the leaf be for ?
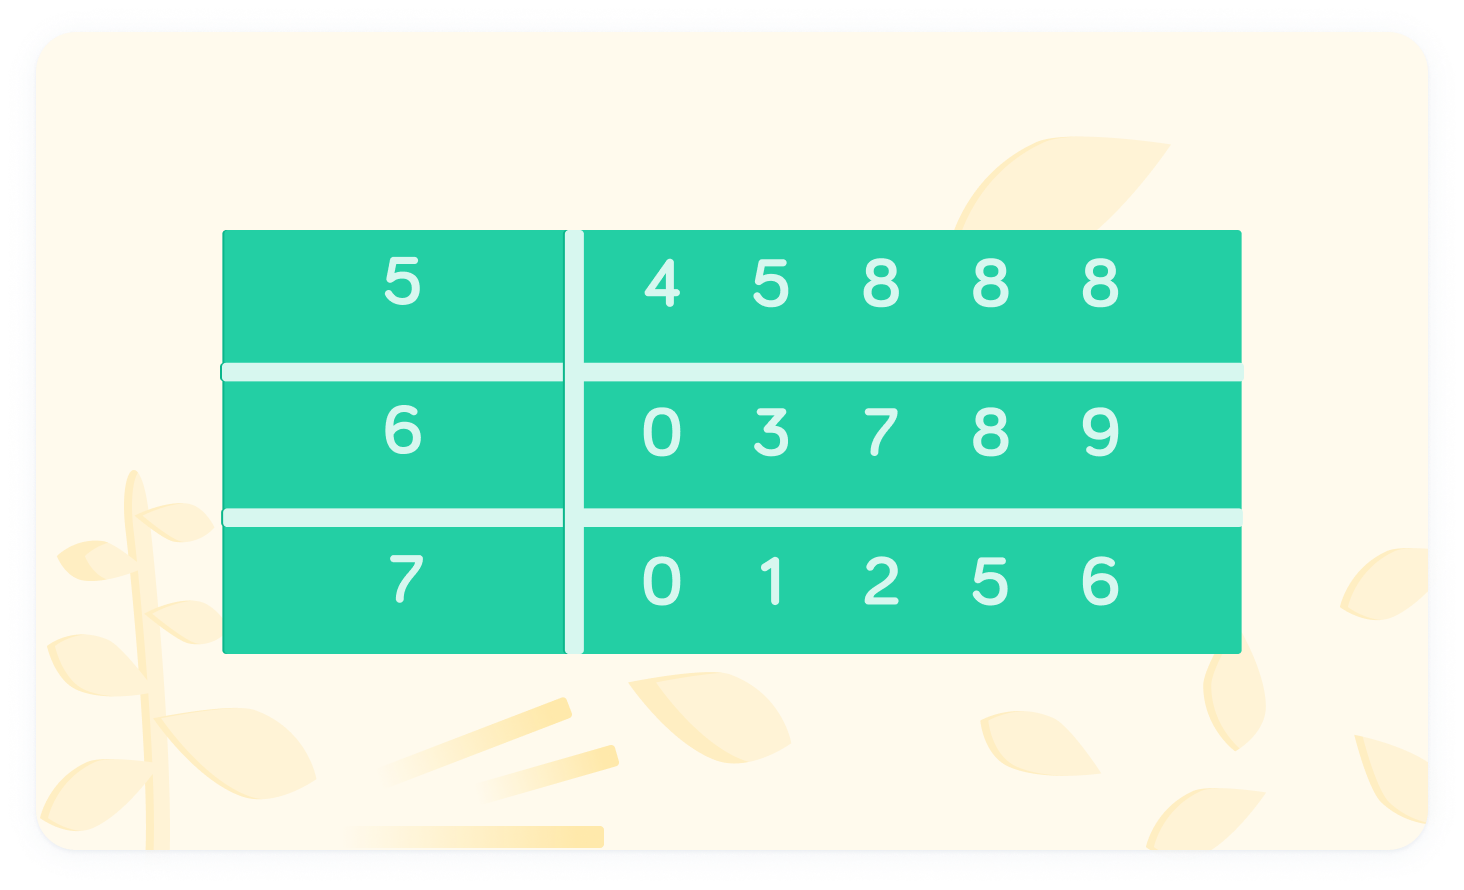
The leaves go on the right side
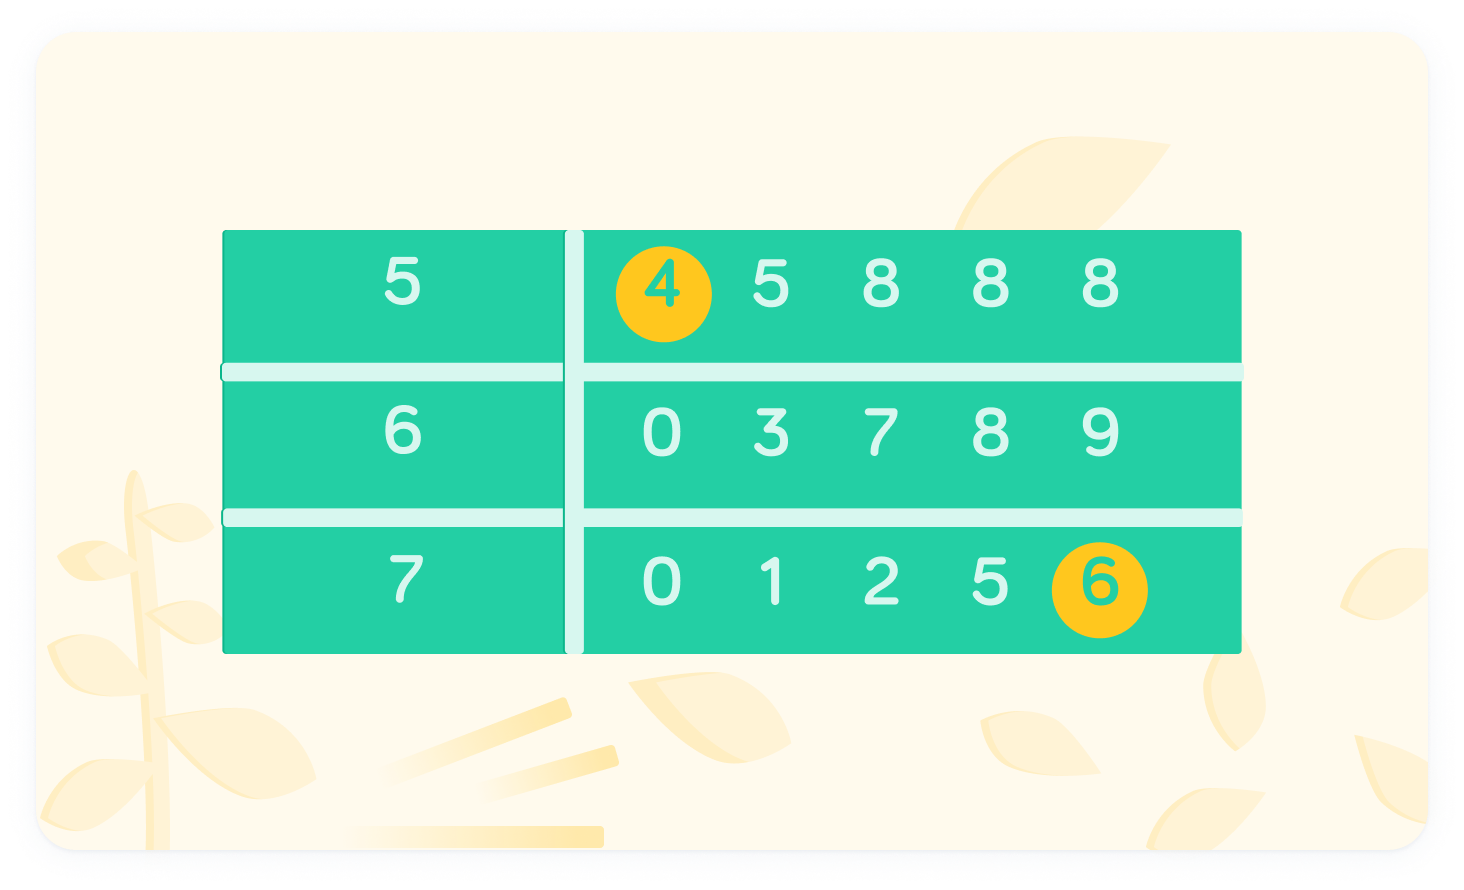
By reading across the table, we find each of the values in the dataset. Each leaf is read with the stem on the left first.
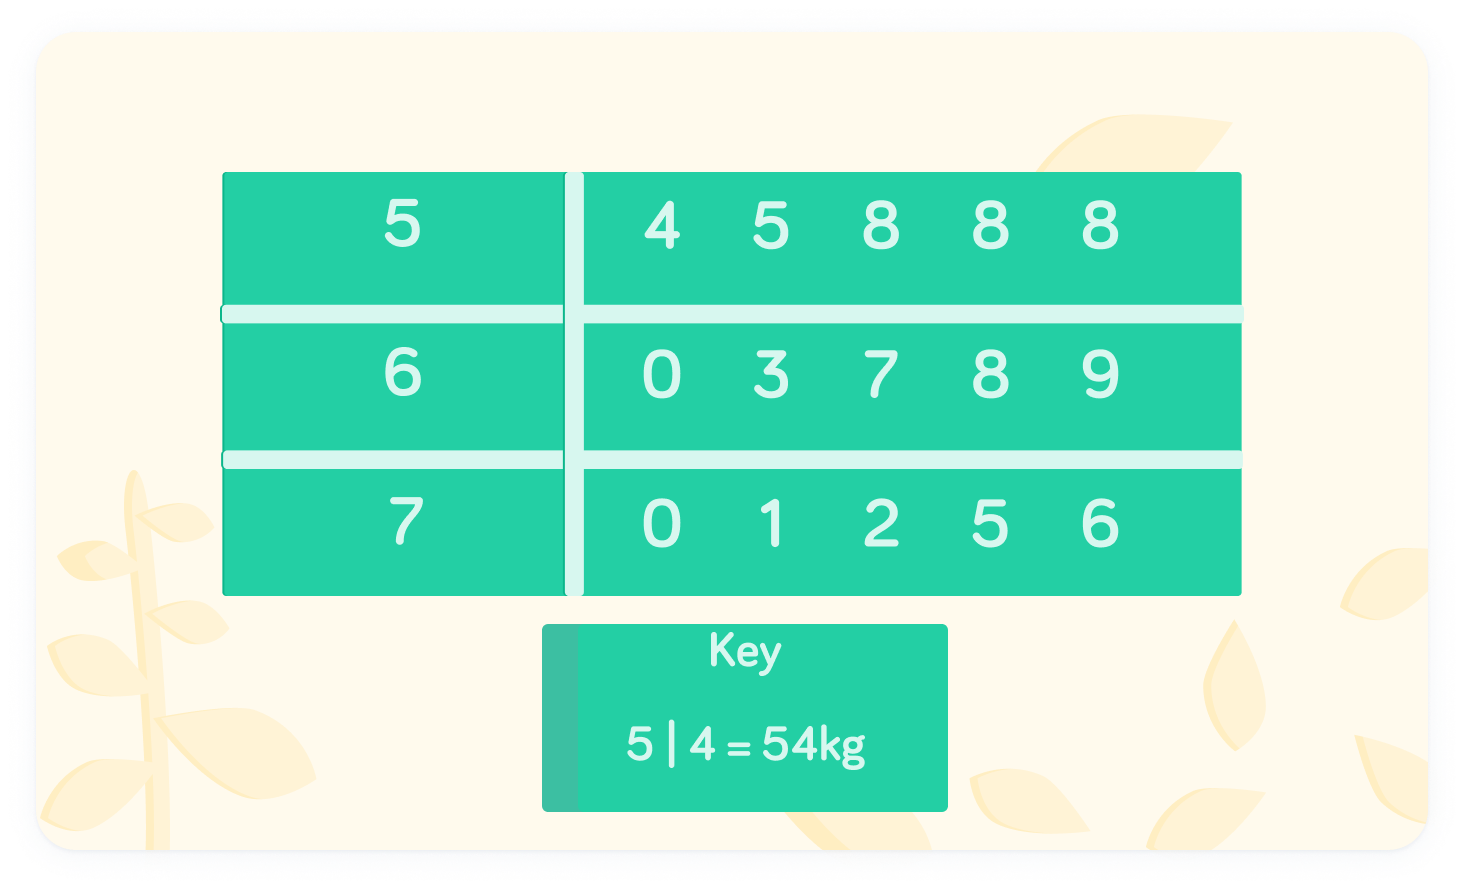
Include a key so the diagram can be understood
This is important for when other people look at the diagram.
What does represent in the diagram?
What does represent?
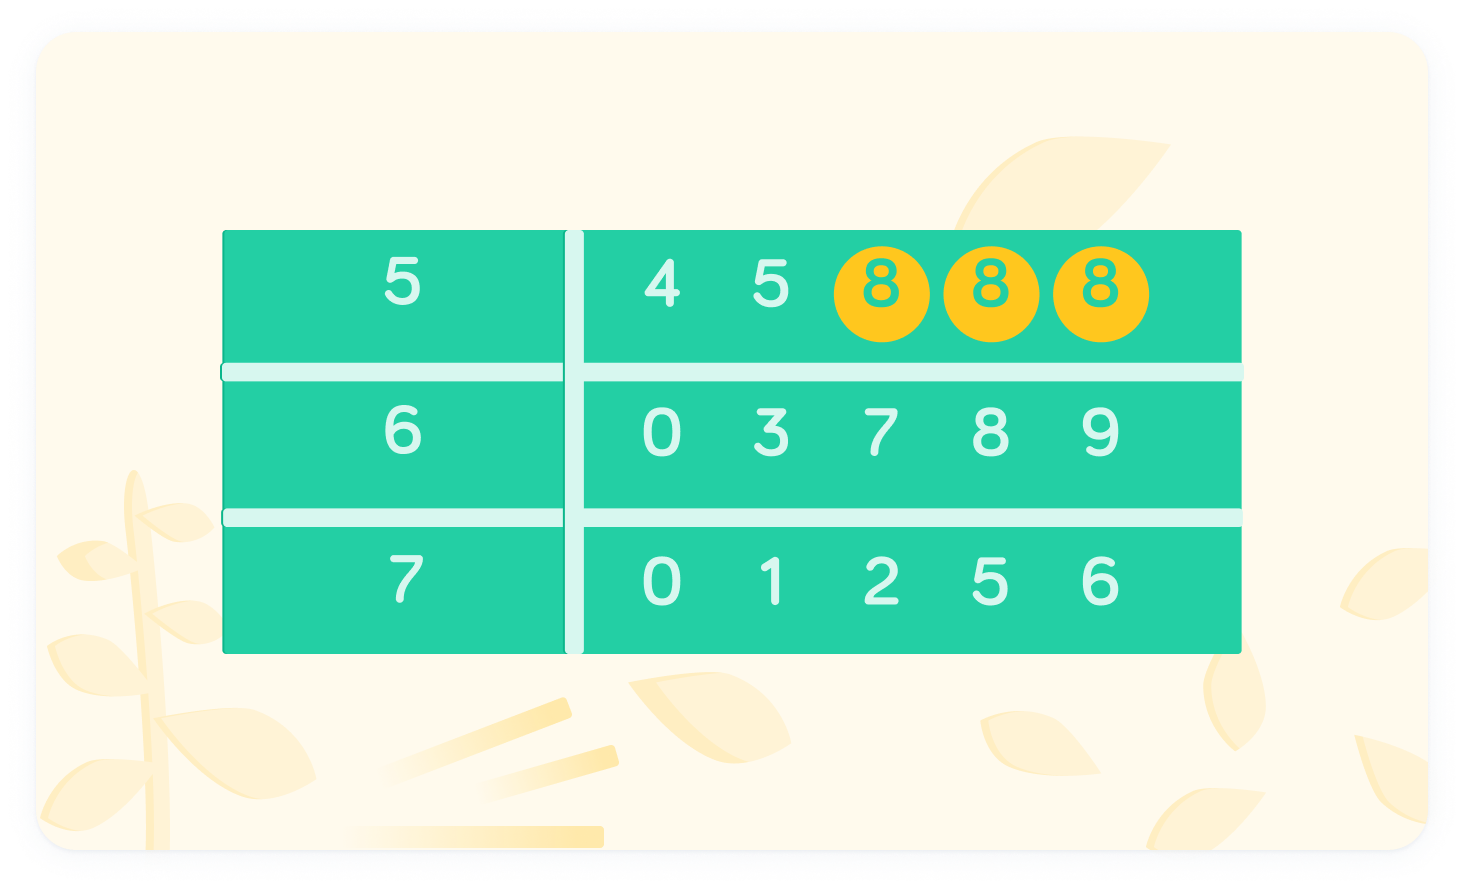
We can find other information from the diagram
For example, we can see both the mode and median easily. Remember, the mode is the most common value, and the median is the middle value once the values have been put in order.
What is the mode?
The mode is
This value appears 3 times, more than any other value in the dataset.
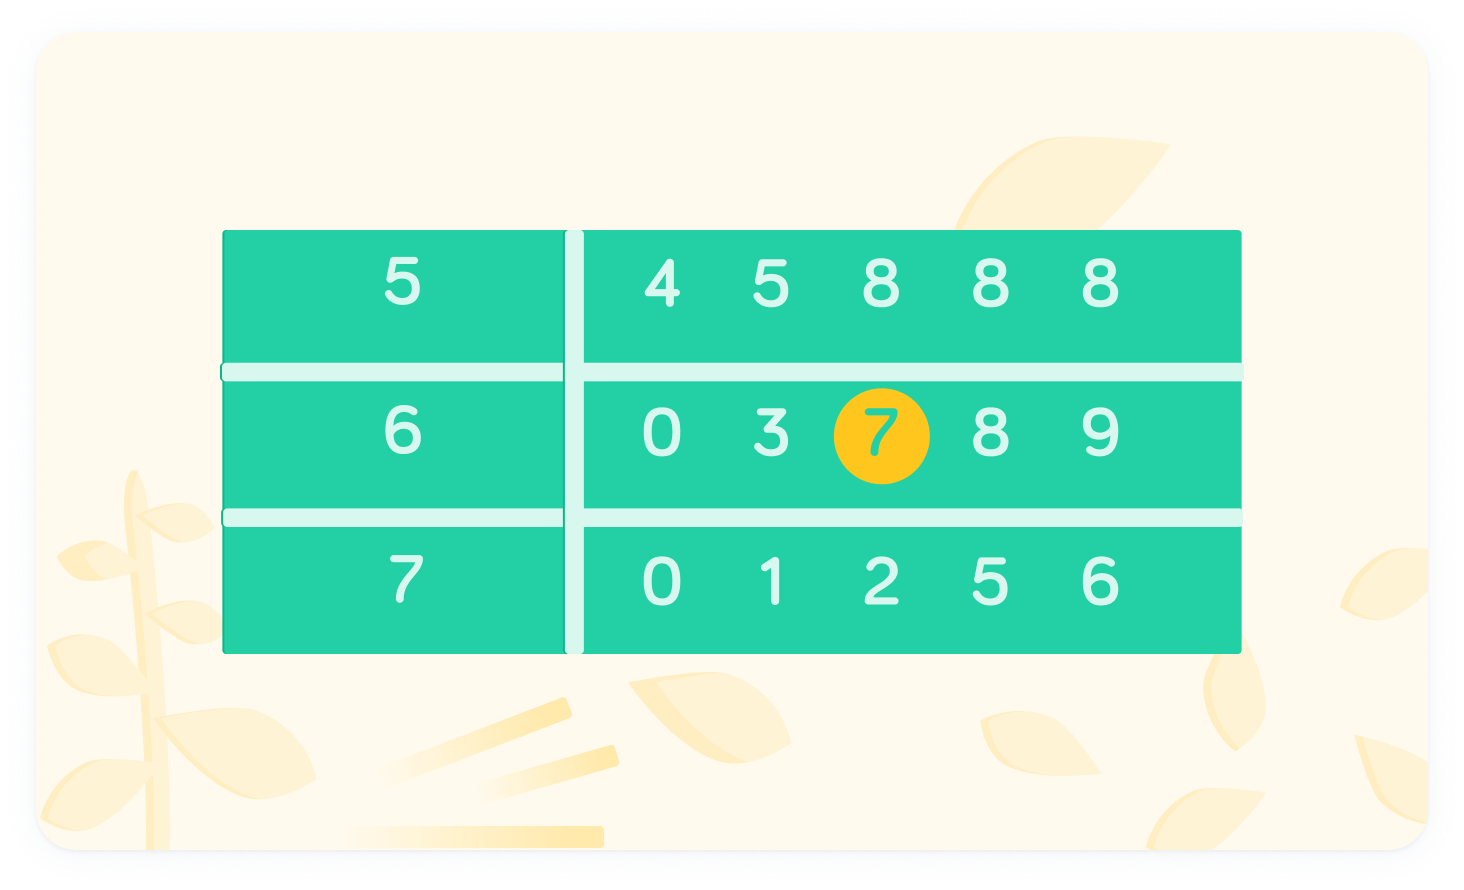
What is the median?
The median is
The values are in order, so we can easily spot the middle value as
What is the range?
The range is
The highest value is , and the lowest is . The range is .