YOU ARE LEARNING:
Grouped Frequency Tables

Grouped Frequency Tables
Grouped frequency tables allow us to see data more clearly when there are a wide range of results.
When we collect a large volume of data, it isn't practical to give every value its own category as it becomes harder to understand. Instead, we can use grouped frequency tables to place similar values into categories.
The data here isn't very well organised
There is a wide variety of answers, and the table looks messy as there are values which are very close to each other, yet still occupy their own line.
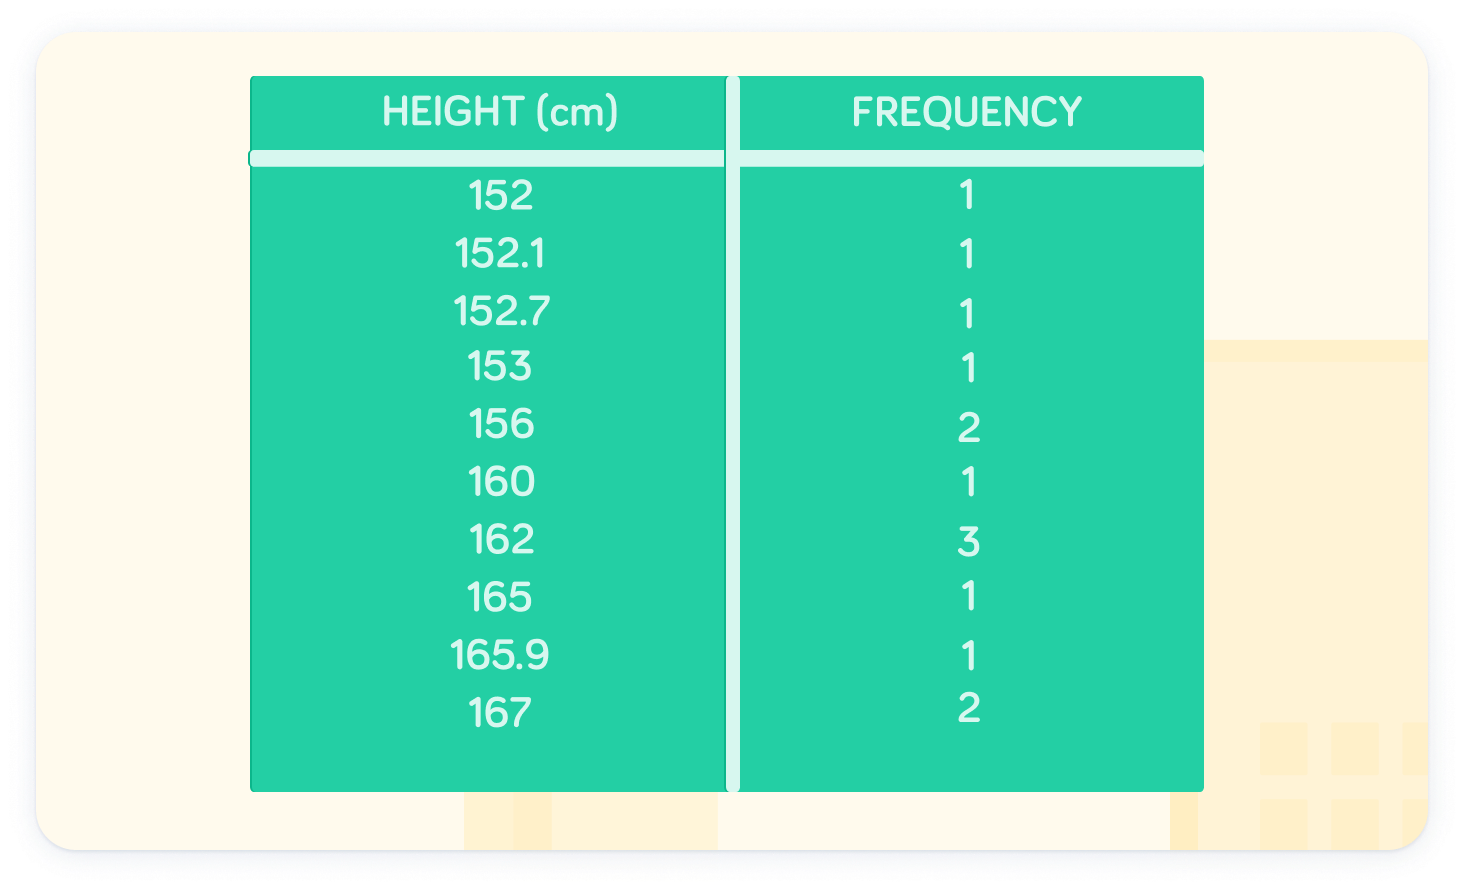
How many people are taller than 160cm?

There are 7 people taller than 160cm
Remember not to include the person that is exactly 160cm!
It could be easier to find a result like this
If we grouped the data, it would be easier to draw insights from the data.
Instead, we can group values into categories
This makes the table much more readable, by grouping similar values together.
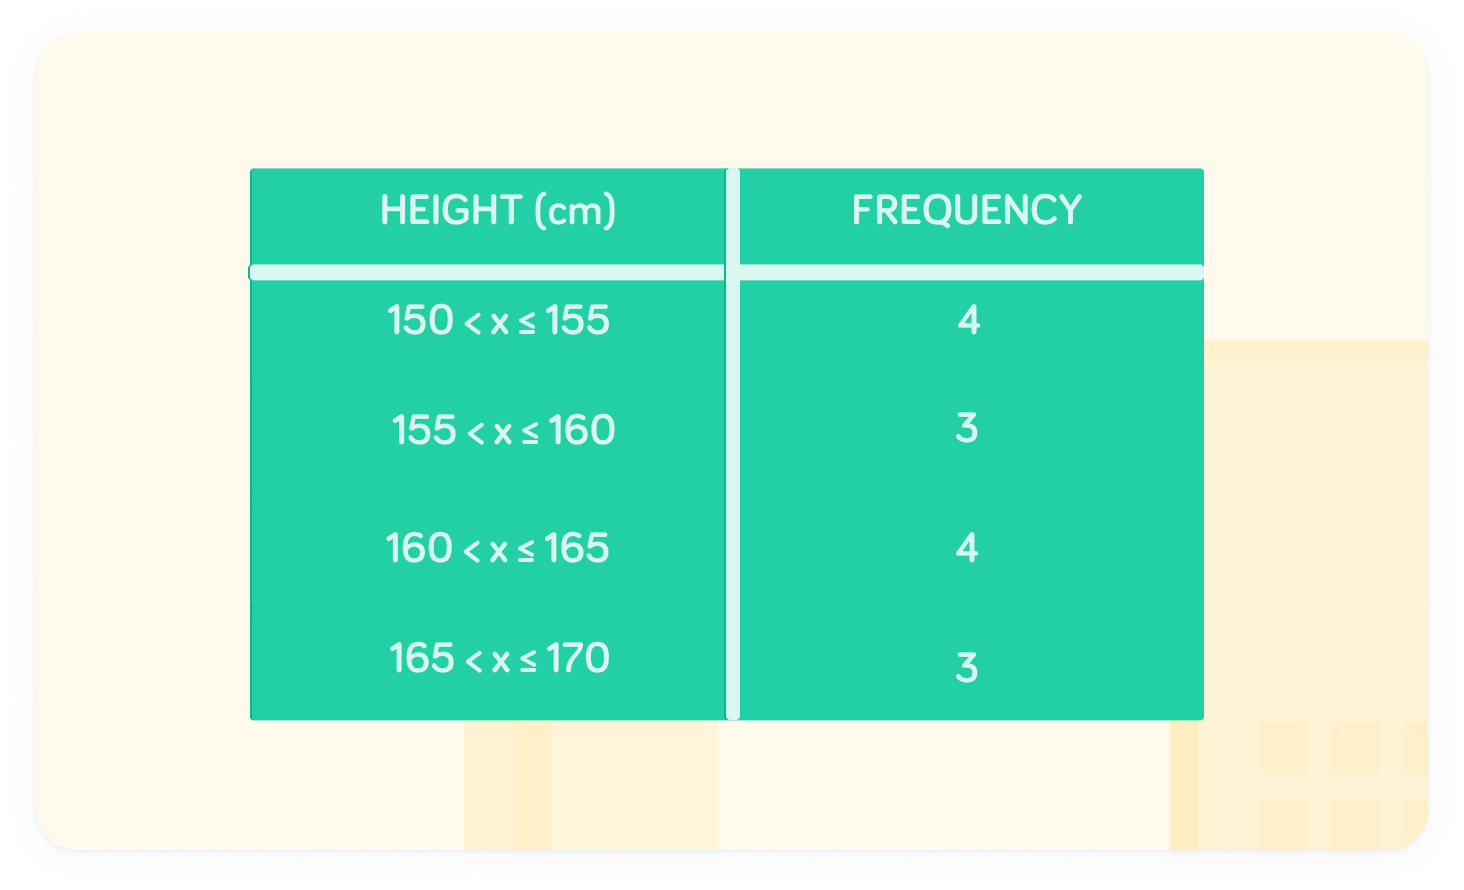
Categories should be exclusive
Notice that a single value can only be part of 1 group in the table. For example, the group contains values between and .
How many people were between 155cm and 165 cm in height?