YOU ARE LEARNING:
The Range

The Range
The range gives us an idea of the how spread out the data is, by finding the difference between the largest and smallest values.
Data can be analyzed by looking at the different measures of averages. However, we can also look at the variance of a set of data - in other words, how spread out the data is.
The range tell us how far apart the lowest value is from the highest value in the set of data, and it can be calculated by subtracting the smallest value from the biggest value in a data set.
A few friends take part in a 100m race. The following is a set of data which describes the times in which they finished. Let's find the range! 10.7s, 11.3s, 12s, 11.1s, 14s
What is the smallest value?

What is the largest value?

Smallest = 10.7 and the largest = 14
Find the difference between these values
14−10.7=3.3
Good work! 😎
The range is 3.3s
The following shows the lengths of a family of blue whales. What is the range, to 3 significant figures? 12.7m, 24m, 25m, 26.5m, 23m, 22m, 21m

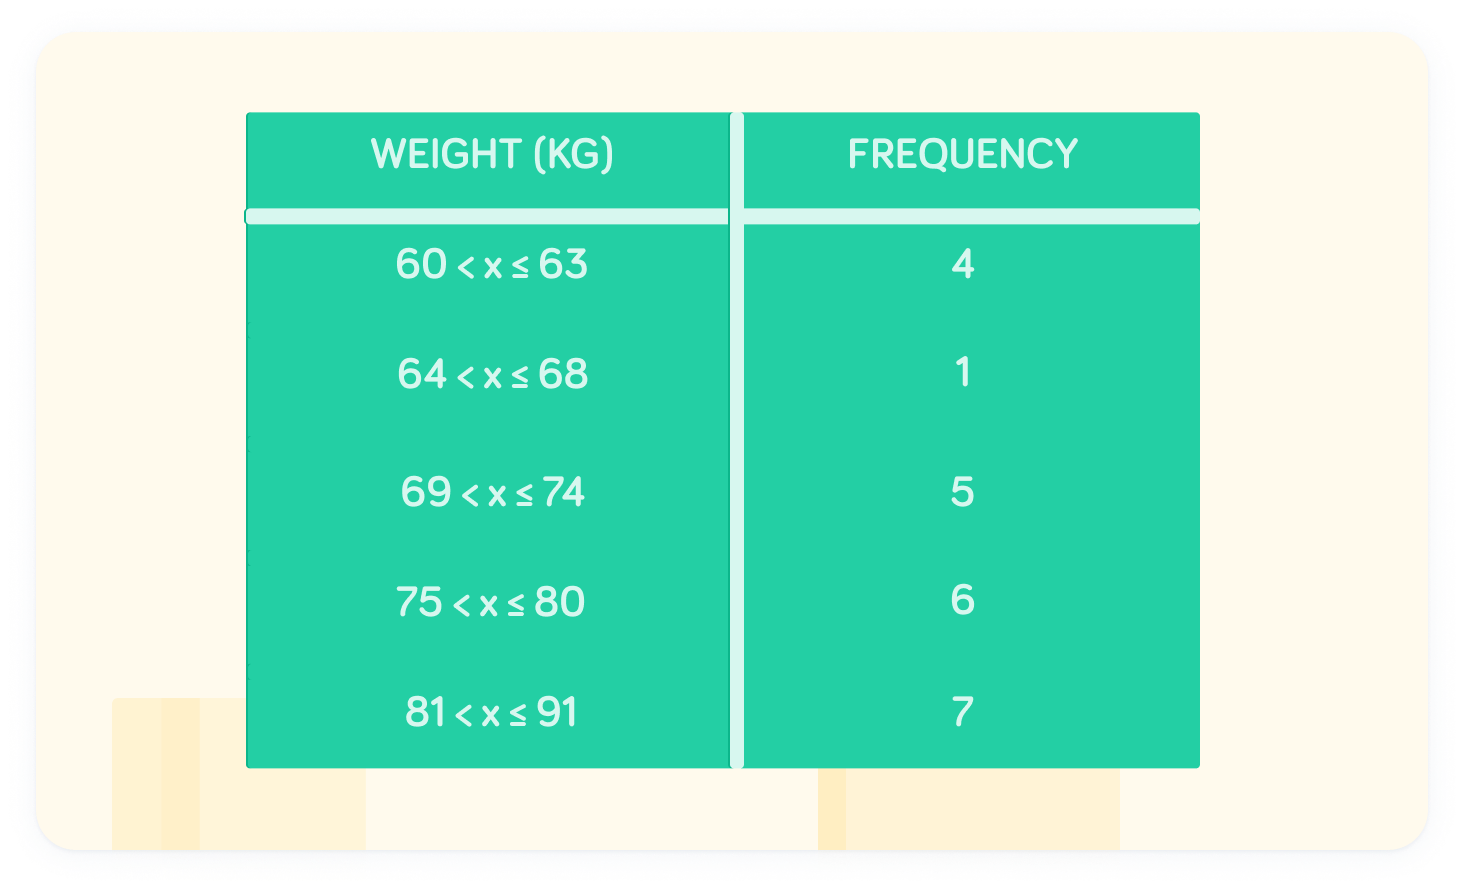
The table shows the amount of boxers in each weight class at a boxing club
Finding the range in grouped intervals is very similar to finding the range with absolute values.

Identify the upper and lower bounds of the intervals
The smallest possible value in the dataset is the lower bound of the smallest interval. Similarly, the largest possible value is the upper bound of the largest interval.

What is the smallest possible value?


What is the largest possible value?


Now we can find the range
The lowest possible value is 60kg and the largest possible value is 91kg. The range is the difference between these two values.

What is the range of weights at the boxing club?


The range of weights is 31kg
91−60=31. Hopefully the boxers will only fight within their classes...

