YOU ARE LEARNING:
Mean from a Grouped Frequency Table

Mean from a Grouped Frequency Table
In grouped frequency tables, it is a little harder to find the mean as we only have groups of values. However, we can use group midpoints to find an estimation of the mean.
When data is grouped in a table, it is harder for us to calculate an accurate value for the mean as we do not have individual data. Therefore, we can only calculate an estimate.
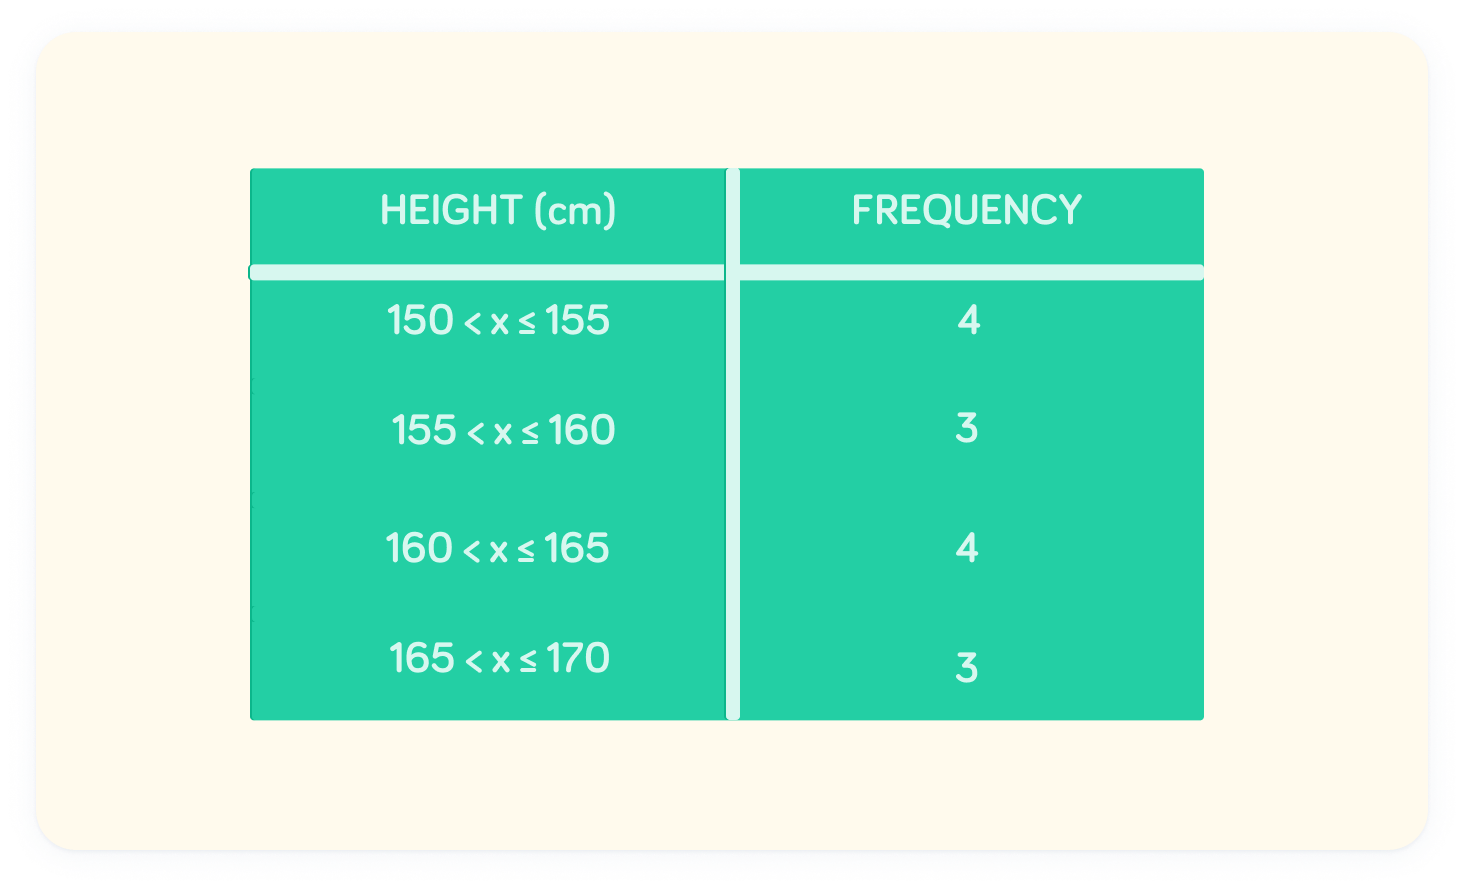
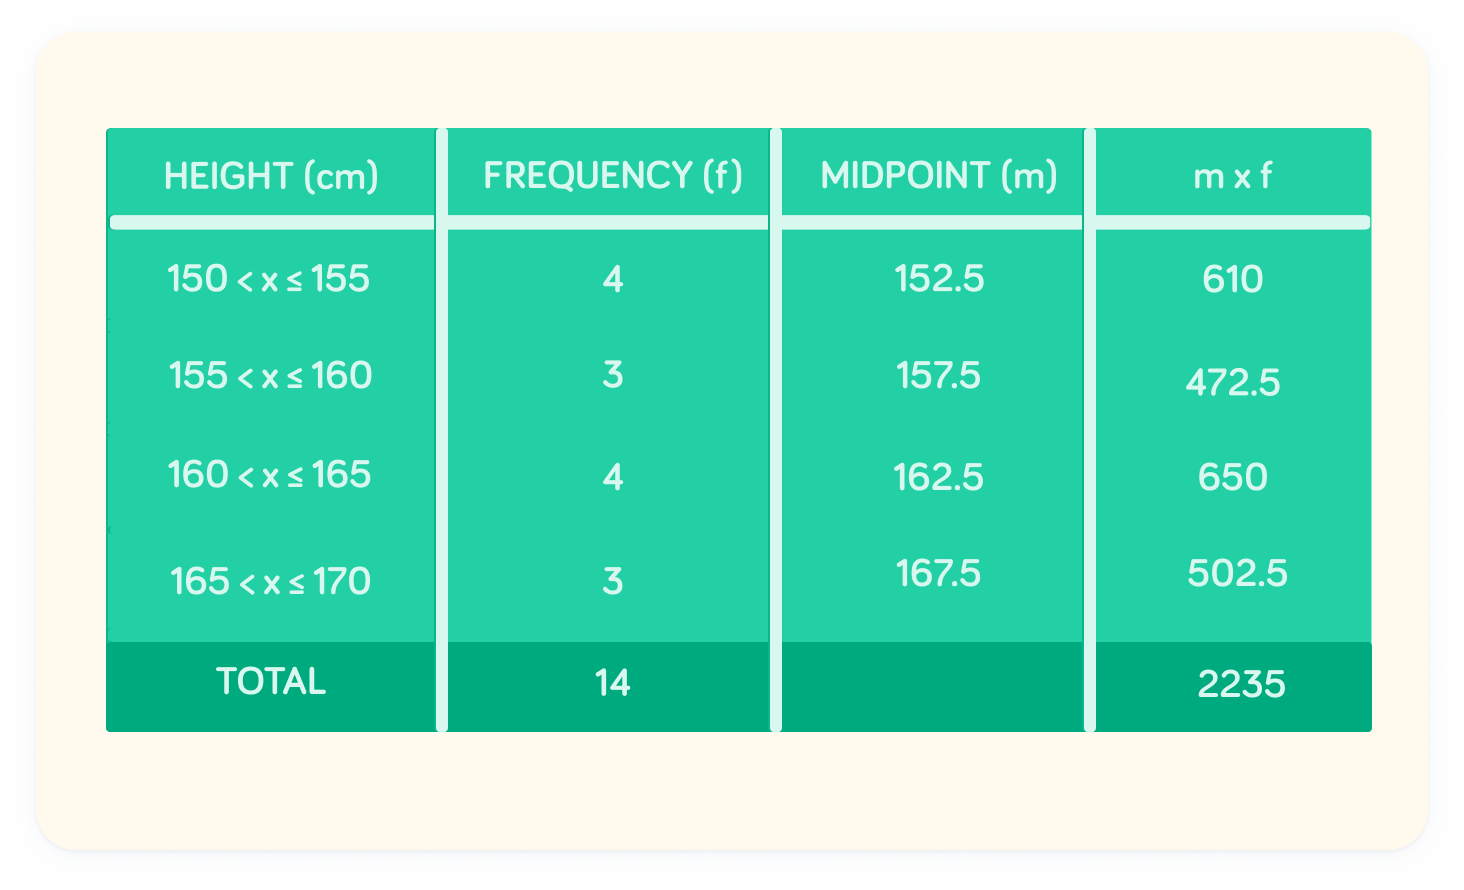
The table shows the heights of a small group of students
We know there are 4 people with a height in the interval , but we do not know exactly how tall each of these 4 people are.
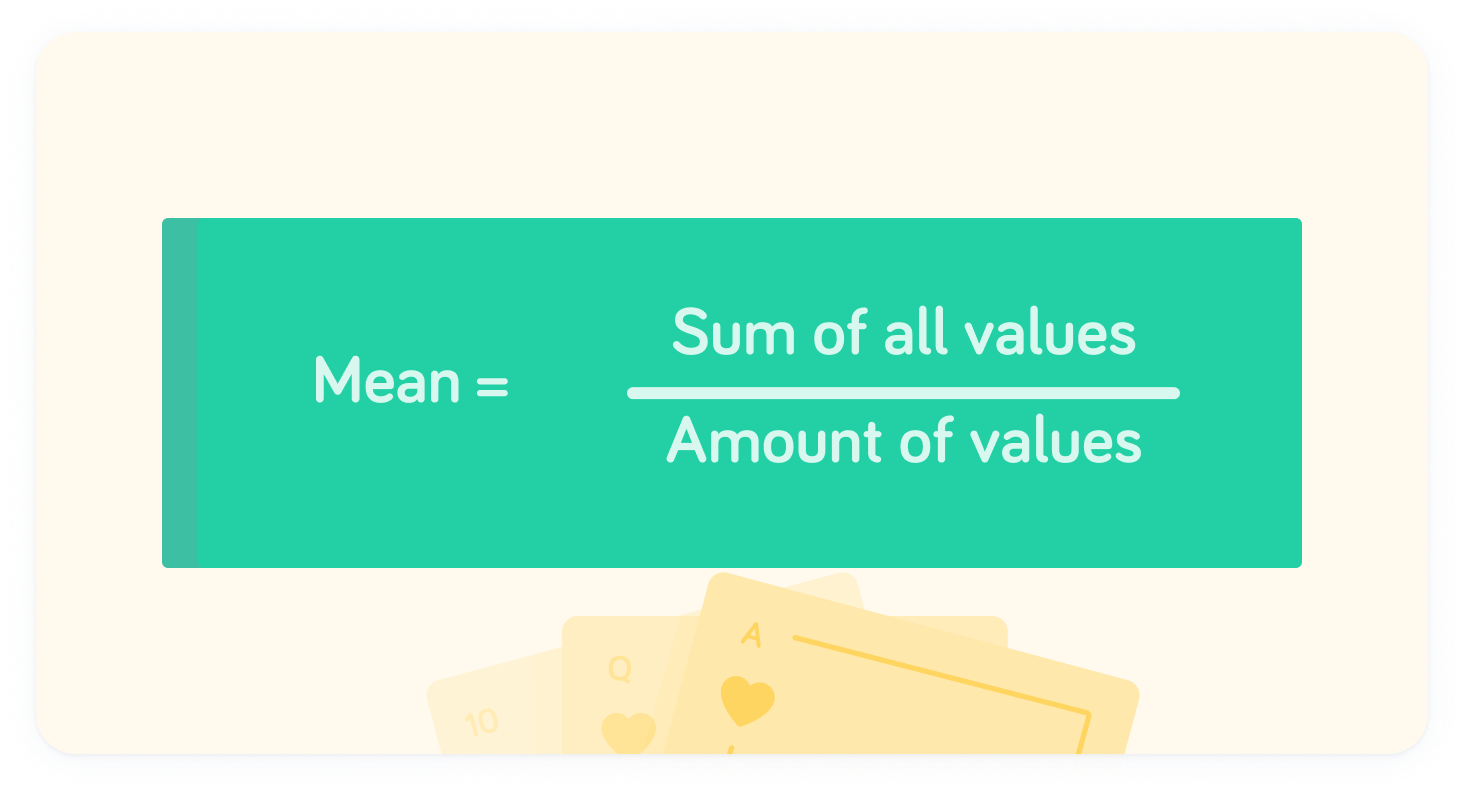
This is the formula for the mean
Without information on the individual height of the students, we will not be able to calculate a “sum” of all the heights. Instead we must use an estimate. A good estimate here is the midpoint of each interval.
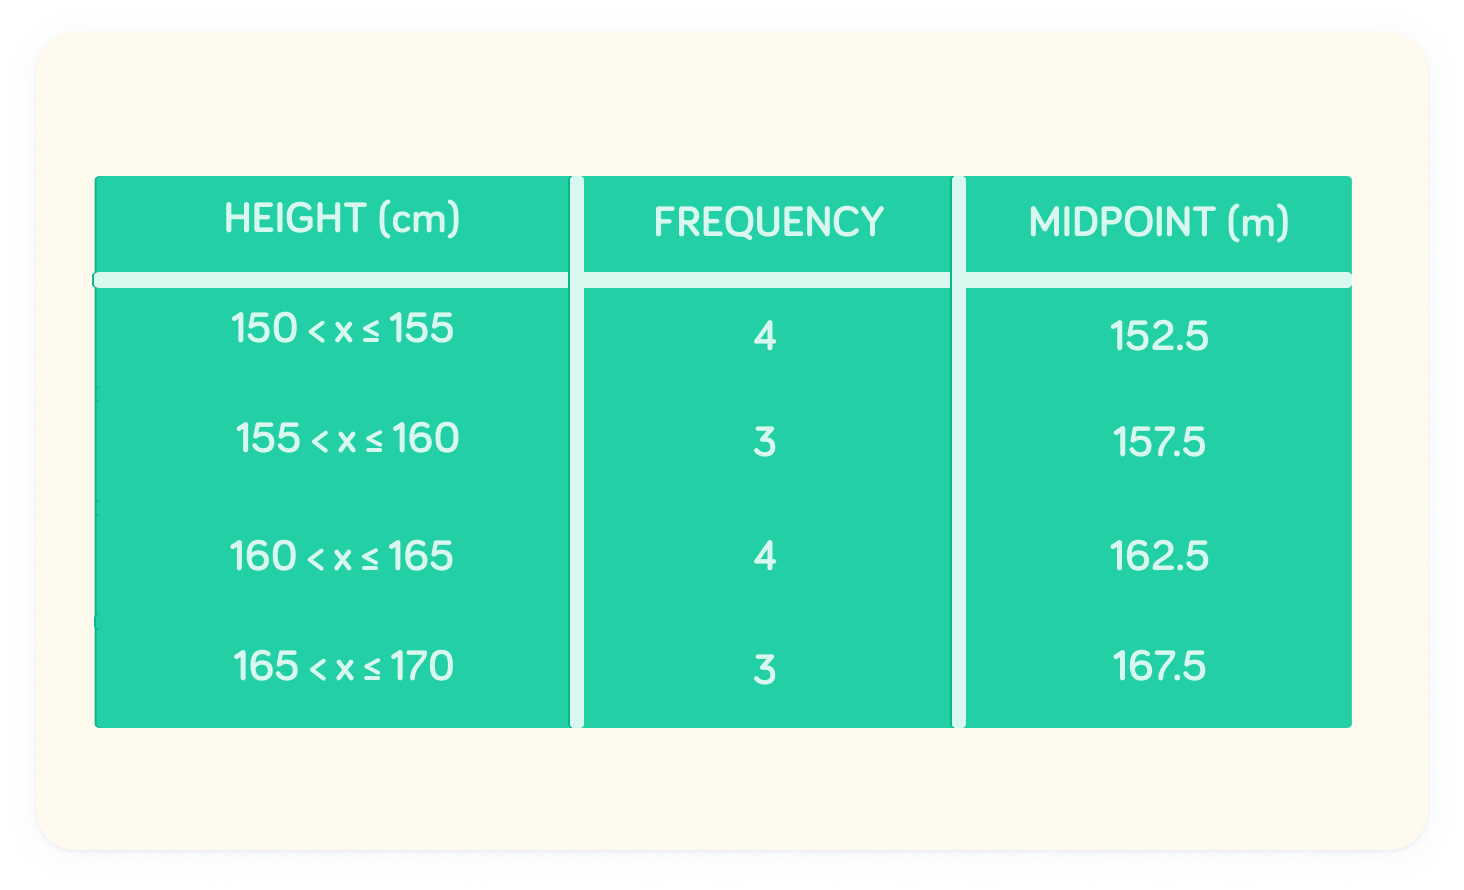
What is the midpoint of the group ?

The midpoint of is
In finding the midpoint, we assume 4 people with the height of 152.5cm, 3 people with the height of 157.5cm, 4 people with the height of 162.5cm and 3 people with the height of 167.5cm.
Multiply the frequency and midpoints together
This will enable us to find an estimate for the sum of all heights.
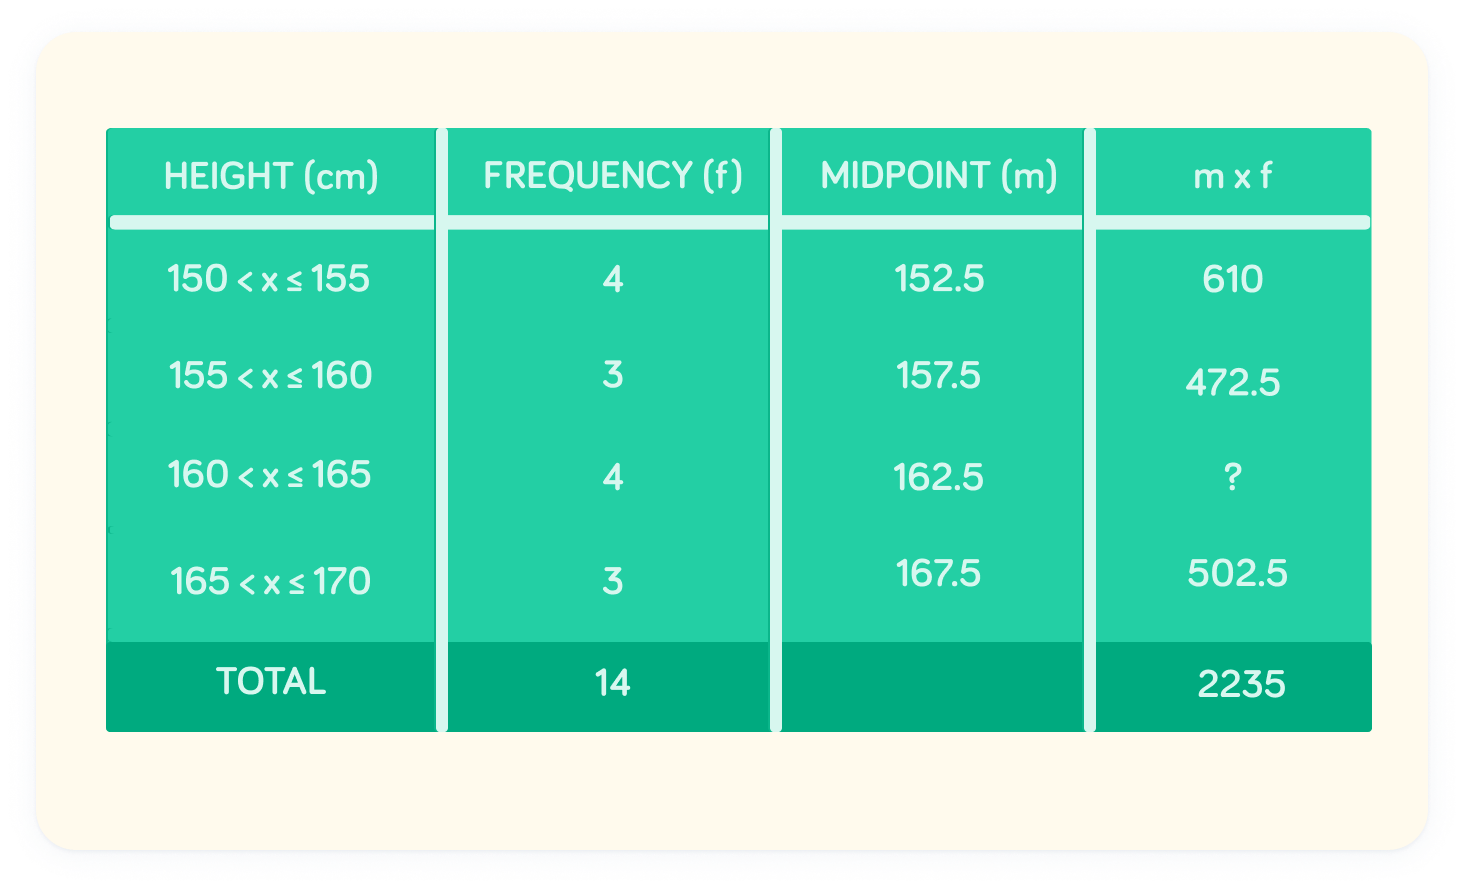
What is the value marked "?" in the table?
The missing value is
We can sum each of these values up to a total of
Now we can find the mean
The sum of all values is , and the total number of values is .
What is the mean height? Give your answer to 1 decimal place
The mean height is
We can find this by dividing . Remember that this is only an estimate for the mean, since we do not have any individual values.