YOU ARE LEARNING:
Distance in Velocity/Time Graphs

Distance in Velocity/Time Graphs
You can calculate the distance travelled by an object by finding the area under a velocity-time graph.
Before we look at any graphs, what equation do you know that can help us calculate the distance travelled by an object?

We can calculate the distance travelled by an object over a certain time interval if we have their speed.
We do this by using the equation
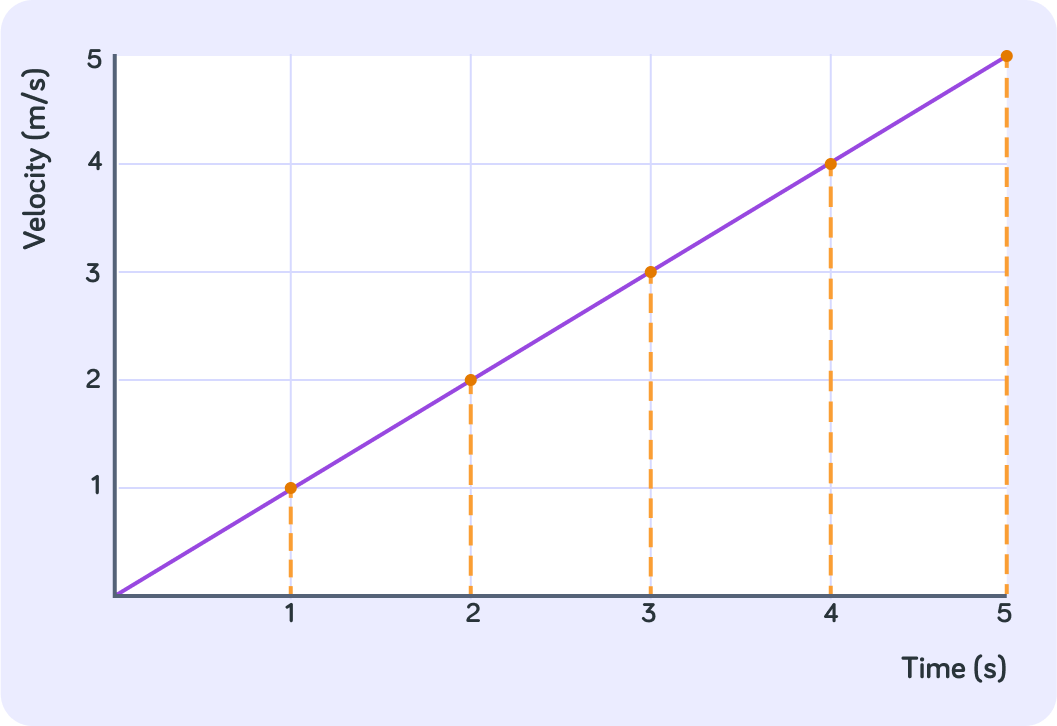
Here we can see a velocity/time graph. What do you think the value of will be equivalent to?
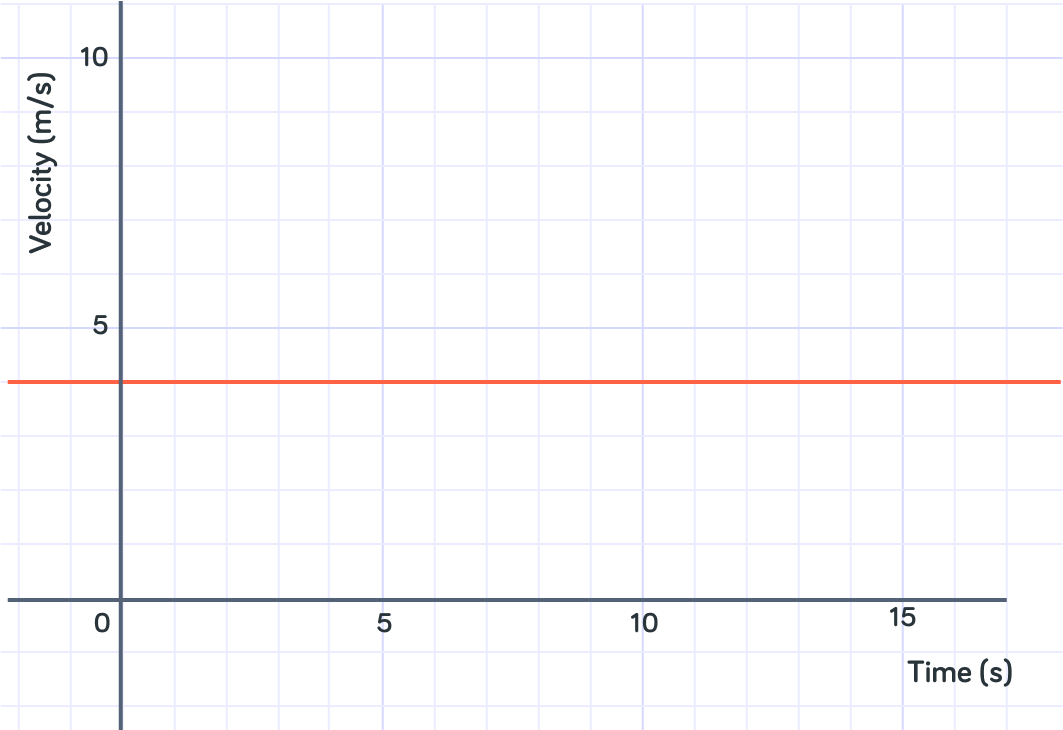
For example, from to the object has been travelling at . What is the distance it has travelled?
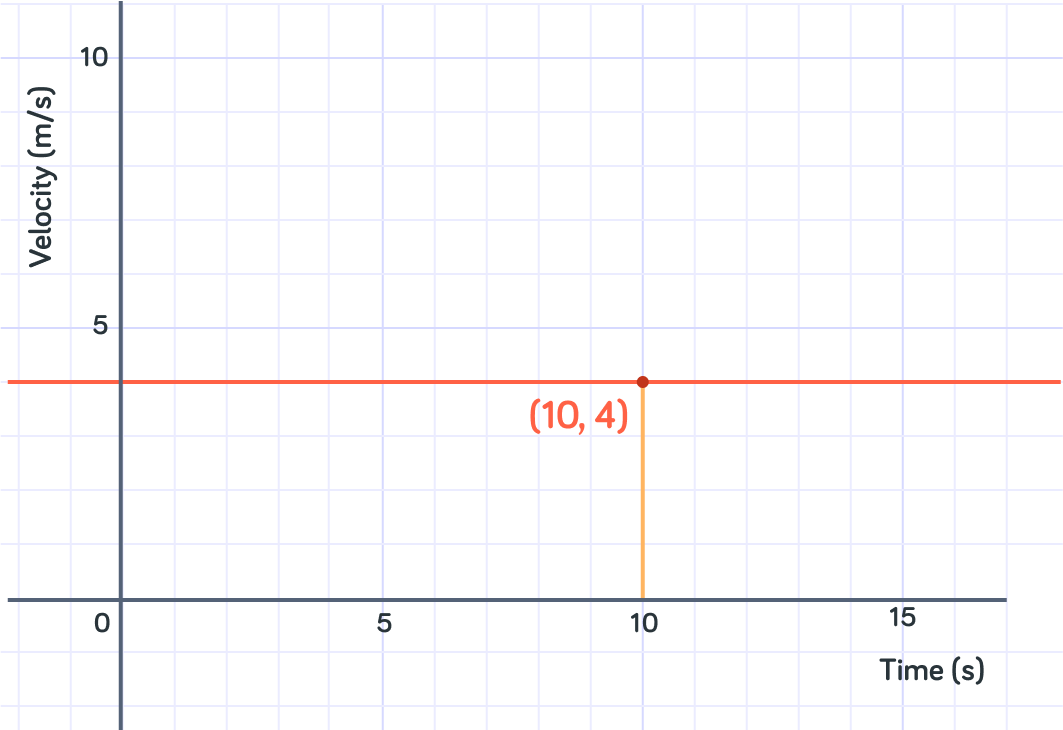
So we calculated the distance travelled by doing .
The area under the line between and makes a rectangle, with base 10 and height 4. So the area of this is which is the same as what we calculated above.
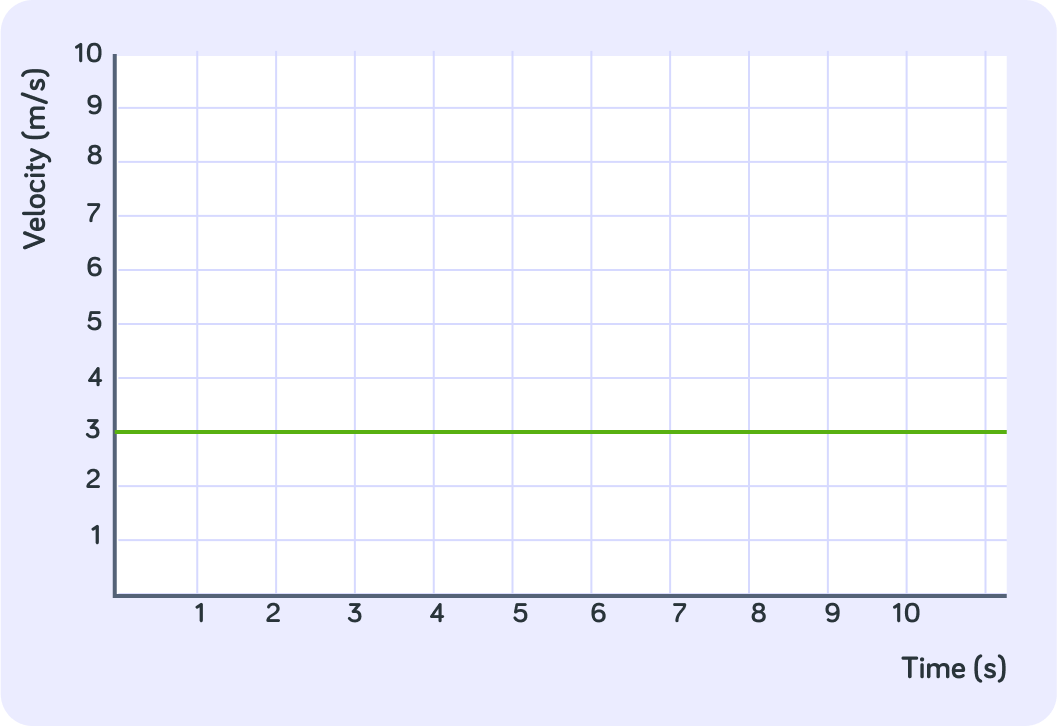
Let's do another example, but more slowly.
What is this object doing?
How far had this object travelled in total between and ?
How far had the object travelled in total after 7 seconds?
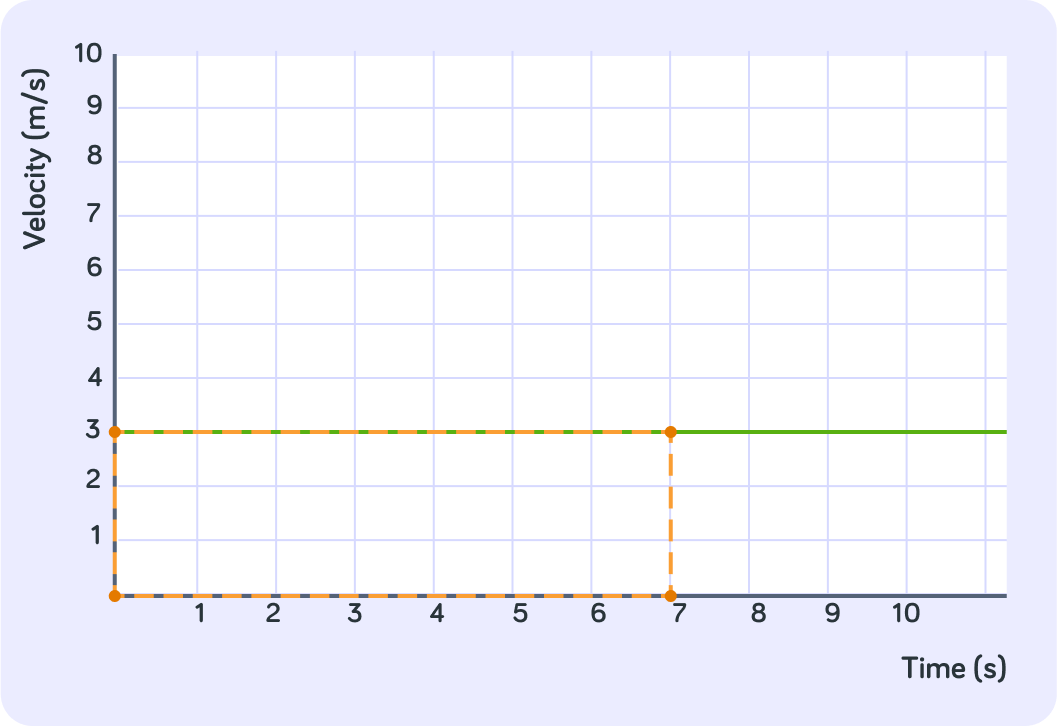
How big is the area underneath the graph between 0 seconds and 7 seconds?
So the area underneath the graph is the same as the total distance the object travelled
After 7 seconds, the object had travelled a total distance of 21 m. The area underneath the graph up until 7 seconds is 21.
How fast was this object moving at 1 second?
How fast was the object moving at 0 seconds?
So over the course of the first second, the object went from to . What is the distance travelled over the first second?
So over the course of the first second, the object accelerated from to .
so .
How fast was the object moving at 2 seconds?
So from to , the object went from to . What was the distance travelled in this interval?
In the first second the object travelled , and in the next second the object travelled . How far had the object gone in total after the first 2 seconds?
What is the area of one square on this graph?
How may full squares are under the curve between and ?
So in the first 2 seconds, this object travelled a distance of .
This is the same as the area underneath the graph for the first 2 seconds. There are 2 full squares in total.
Counting the squares under the graph isn't always the best option, for example if there are hundred of squares!
But, you can also calculate the size of the area under the graph
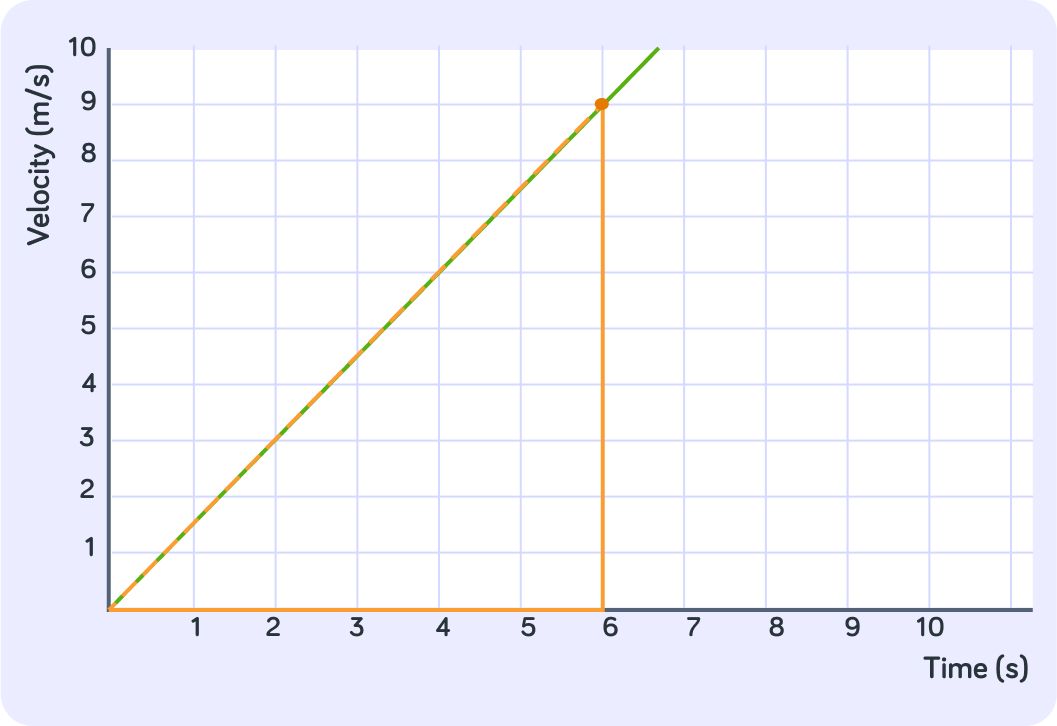
What shape is the area under this graph between 0 seconds and 6 seconds?
How do you calculate the area of a triangle?
What is the value of the base of this triangle?
What is the value of the height of this triangle?
What is the area of this triangle?
How far had this object travelled after 6 seconds?
For the first 8 seconds, what was this object doing?
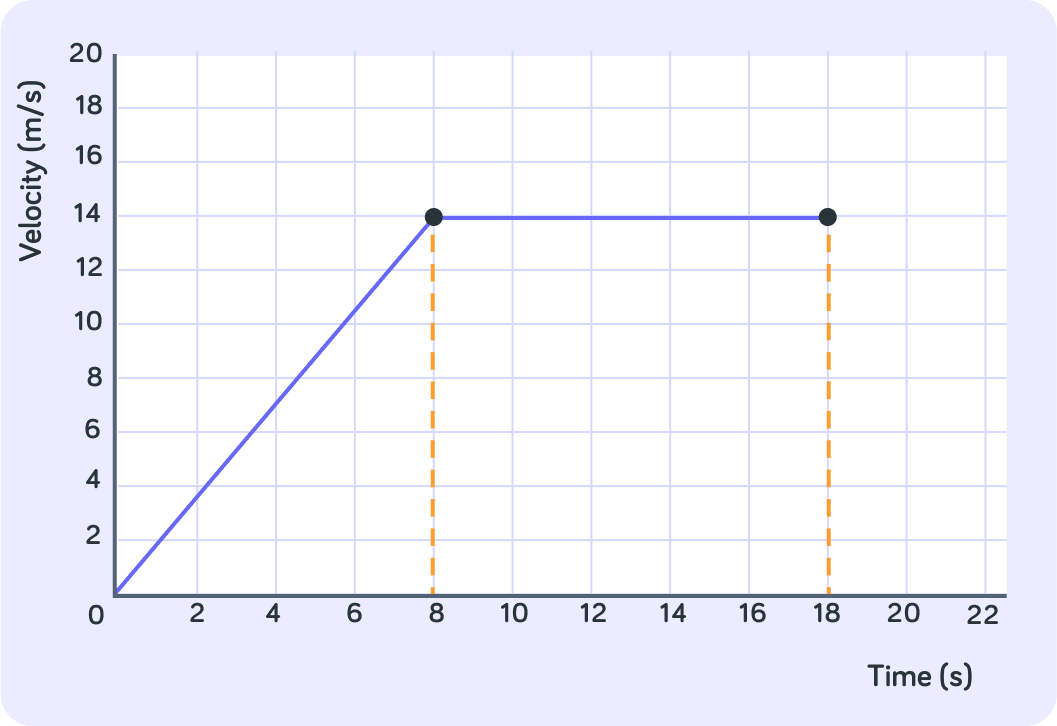
Between and what was this object doing?
We can find the area under the curve by splitting it into easy shapes
In this case, a triangle and a rectangle
What's the area of the triangle?
What's the area of the square?
What was this object's total distance after 18 seconds?
Making estimations
Can we calculate precisely what the area under this curve is? Answer yes or no.
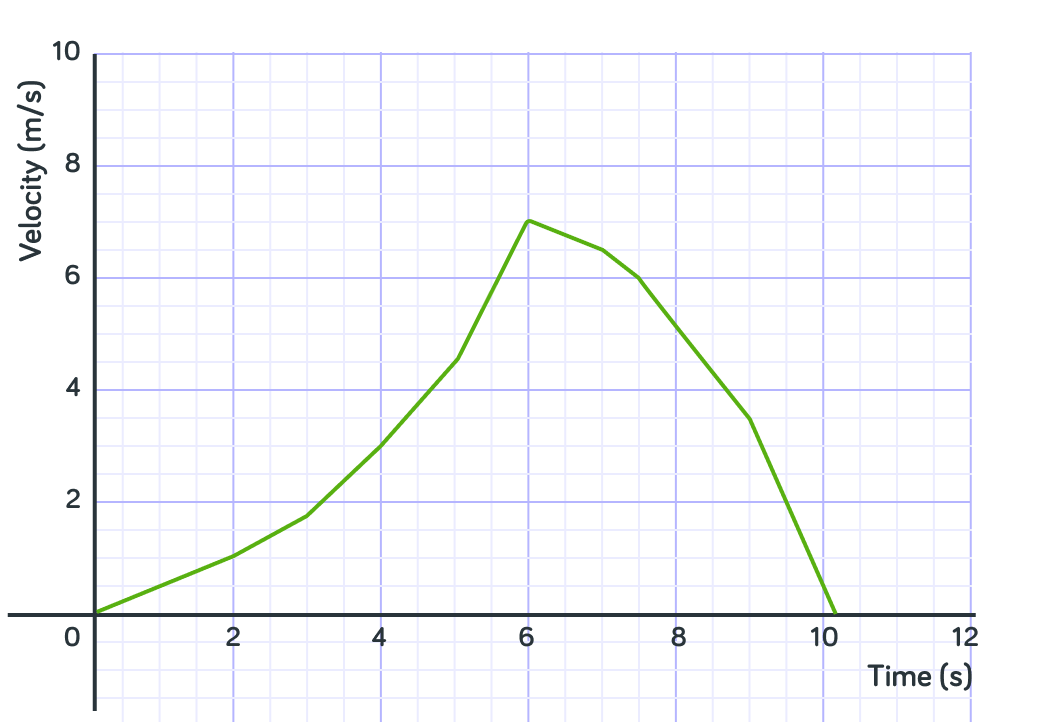
We can't split this area into simple shapes very easily. But, what we can do is make an estimation for the area under the graph**.** This will give us a value that is almost correct. What method do you think is best for this?
So to make an estimation, we can count the squares under graph. How many full squares are there underneath this graph?
So you can say that the area under the curve is about 24, because there are 24 full 1x1 squares. However, we can be bit more accurate. Out of the non-full squares, how many are there which have over half of their area under the graph?
So there are full squares under the curve and half (or more) squares under. The rest of the partial squares we will ignore, so we can round up the half squares we have already counted. So, what is out estimation for the total area under the curve?
Summary!
The size of the area underneath the graph in a velocity/time graph is the same as the distance the object travelled
This is because
To find the area, you can either count the squares under the line...
or calculate it by splitting it into different shapes and using formulas for area.
When the graph is not all straight lines...
we can estimate the area under the curve by counting the squares.