YOU ARE LEARNING:
Velocity/Time Graphs

Velocity/Time Graphs
Velocity/time graphs show you the direction and speed of a moving object.
This is a velocity/time graph. What does it have in common to a distance/time graph?

So both V-T graphs and D-T graphs have time as their independent variable.
They differ in their dependent variables.
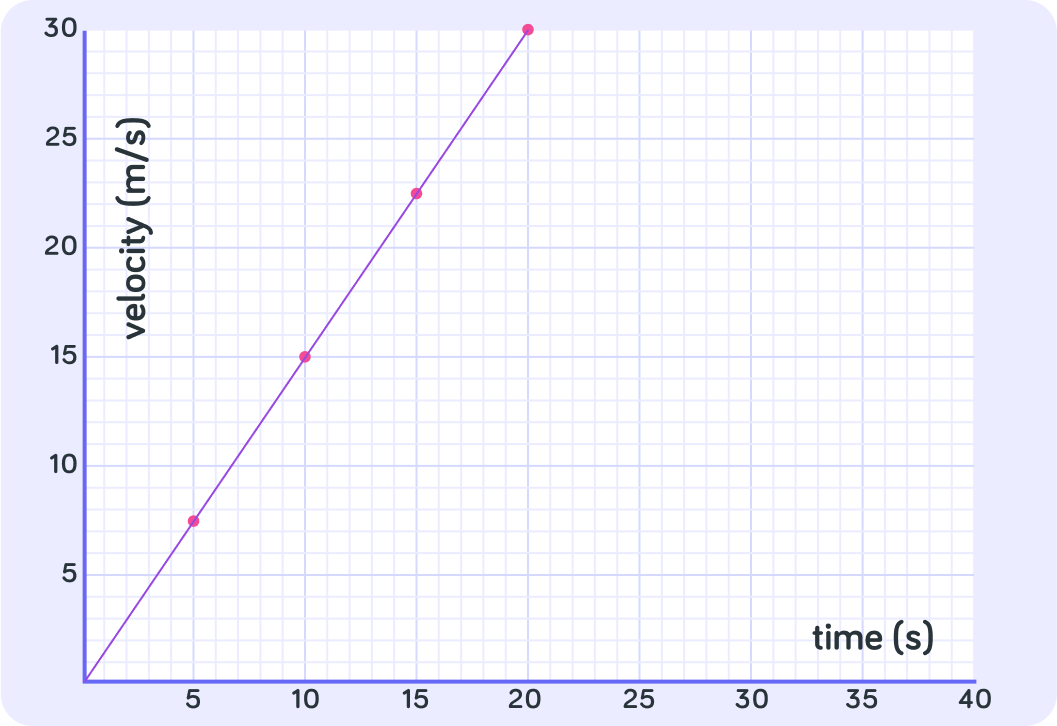
Let's try reading this graph.
What was this object's velocity after 10 seconds?
So at time = 10 seconds, the object was travelling at .
This information is given by the point .
What was this object's velocity after 20 seconds?
True or false? This object was moving faster after 20 seconds than after 10 seconds.
After 10 seconds the object was moving with a velocity of , and after 20 seconds it was moving with a velocity of . That means that this object was...
So this is a velocity/time graph that shows an accelerating object.
The further out on the x-axis you go, the higher the velocity (m/s) gets.
What is the acceleration of this object?
Horizontal Lines
How would you describe the motion of this particular object?
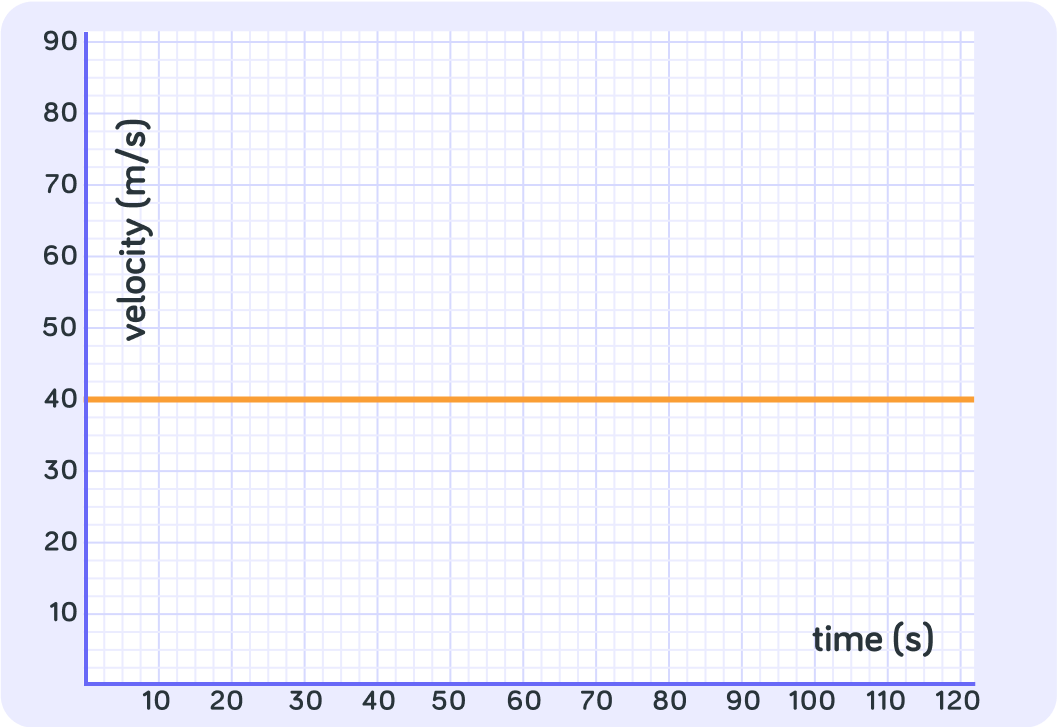
What is the slope, and thus the acceleration, of this object?
So this is a velocity/time graph that shows an object that is moving at constant speed - it has acceleration of
No matter when the object's velocity was measured, it was unchanged. It stayed at .
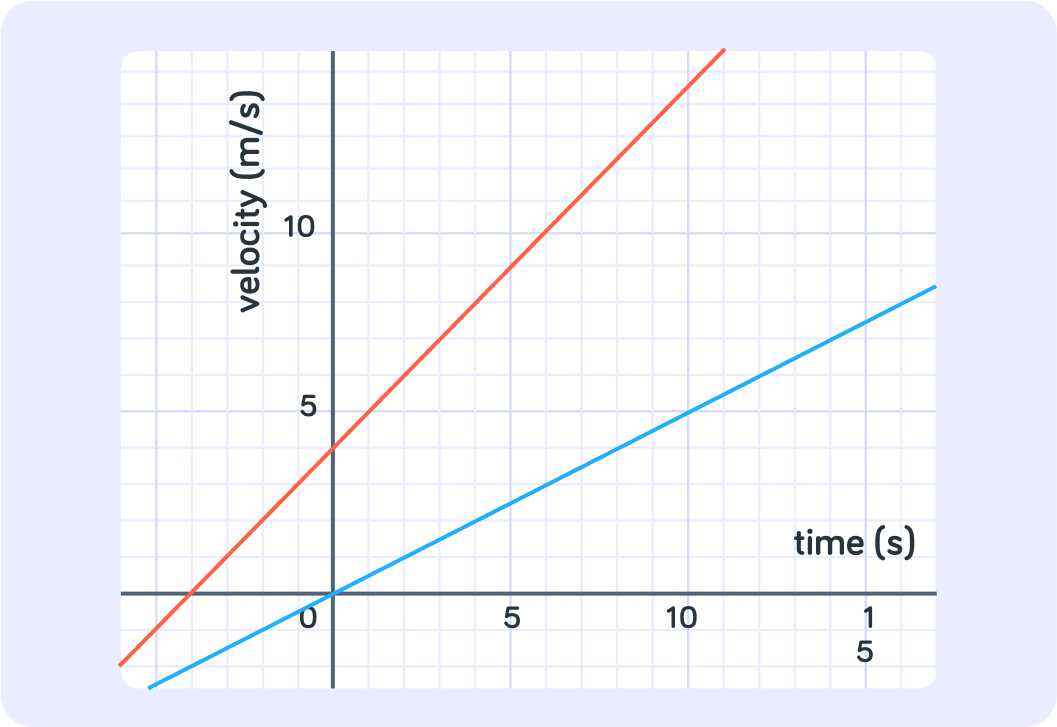
Positive Gradients
What is the change in velocity here from 10 seconds to 20 seconds?
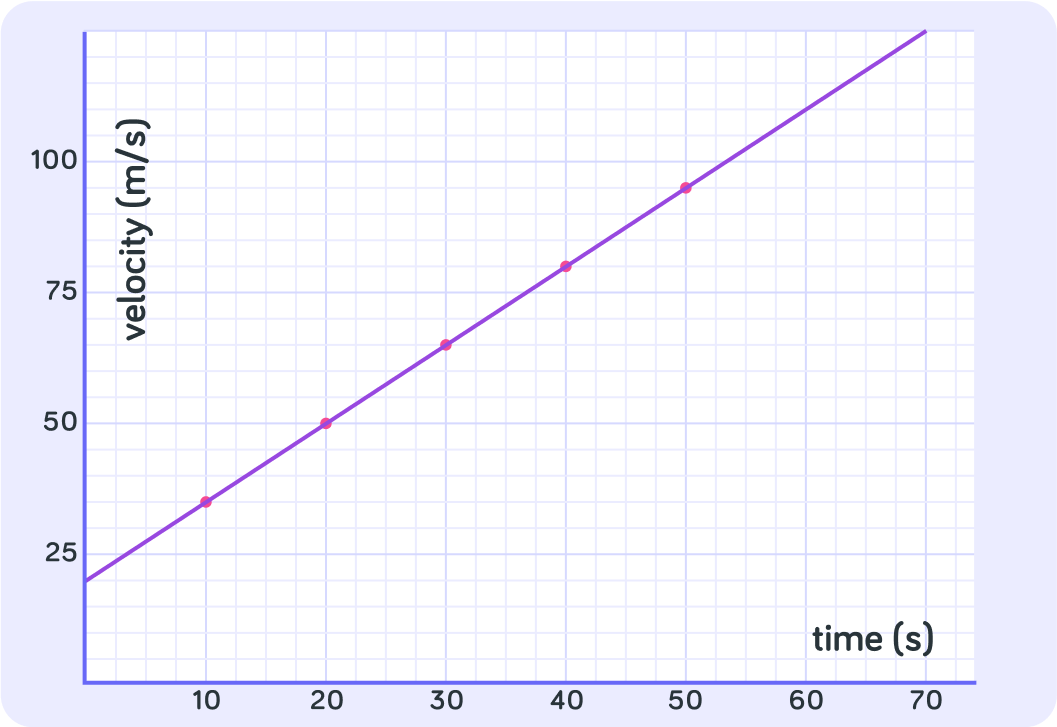
So at 10 seconds, the velocity is , and at 20 seconds the velocity is . What is the acceleration in over the course of those 10 seconds?
Between 10 and 20 seconds, the acceleration of the object is . Is that the same between 30 seconds and 40 seconds? Answer yes or no.
True or false? This object is moving at constant speed.
True or false? This object is speeding up at a constant rate.
So, a velocity/time graph with a positive gradient shows an object with a constant (unchanging) acceleration.
We call this uniform acceleration.
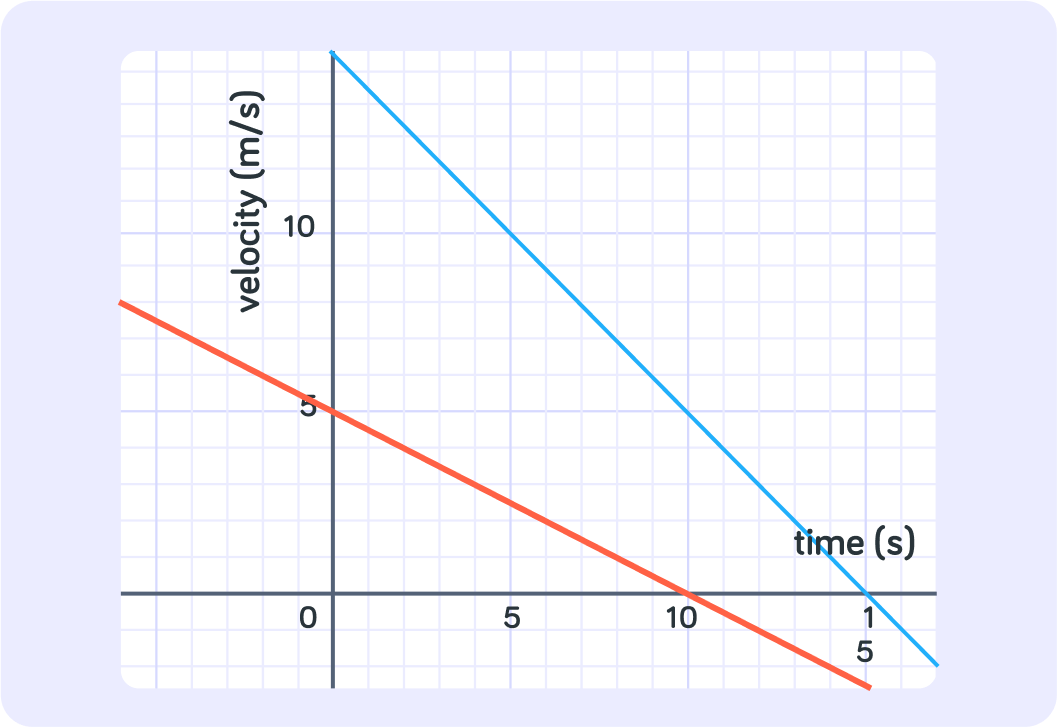
Negative Gradients
How was the velocity of this object changing over time?
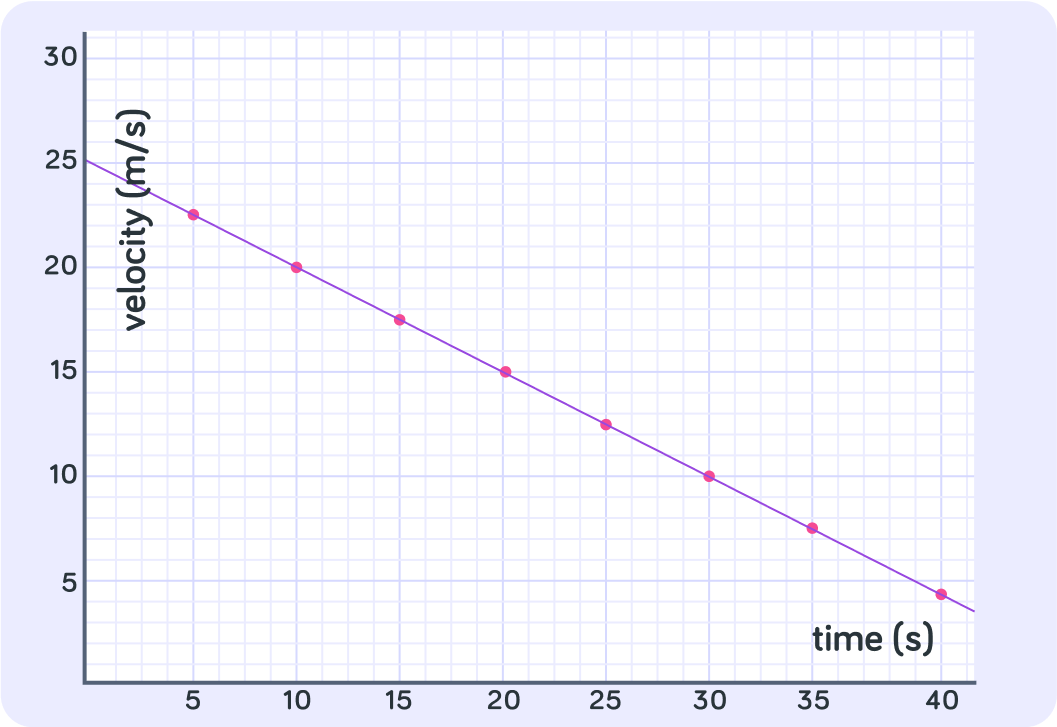
So this object was...
So this is a velocity/time graph that shows an object that is slowing down or decelerating.
The further out on the x-axis you go, the lower the velocity (m/s) gets.
What kind of acceleration does this object have?
Calculate the acceleration of this object.
So a negative gradient shows negative acceleration. Is this uniform acceleration?
So, a velocity/time graph with a constant negative acceleration...
shows the motion of an object with uniform deceleration.
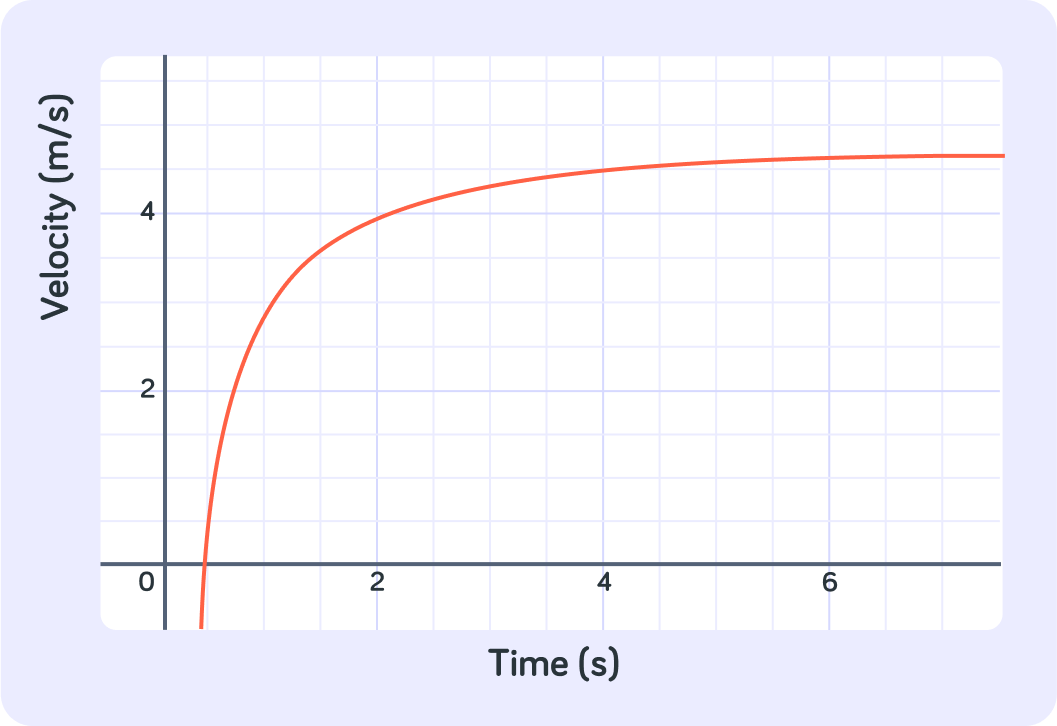
Curved Lines
Is the gradient the same at all points on this graph?
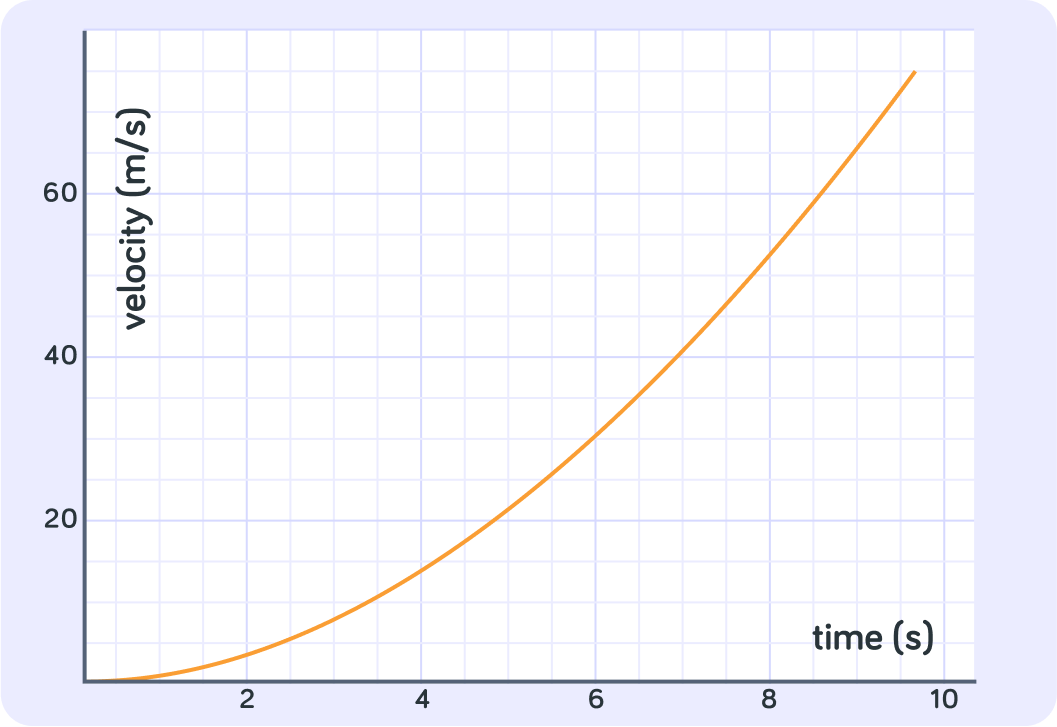
Was this object speeding up at a constant rate?
This curved line shows that the object was speeding up faster and faster
The further out the x-axis you go, the steeper the graph gets, so the larger its acceleration gets.
The green line shows an object that is...
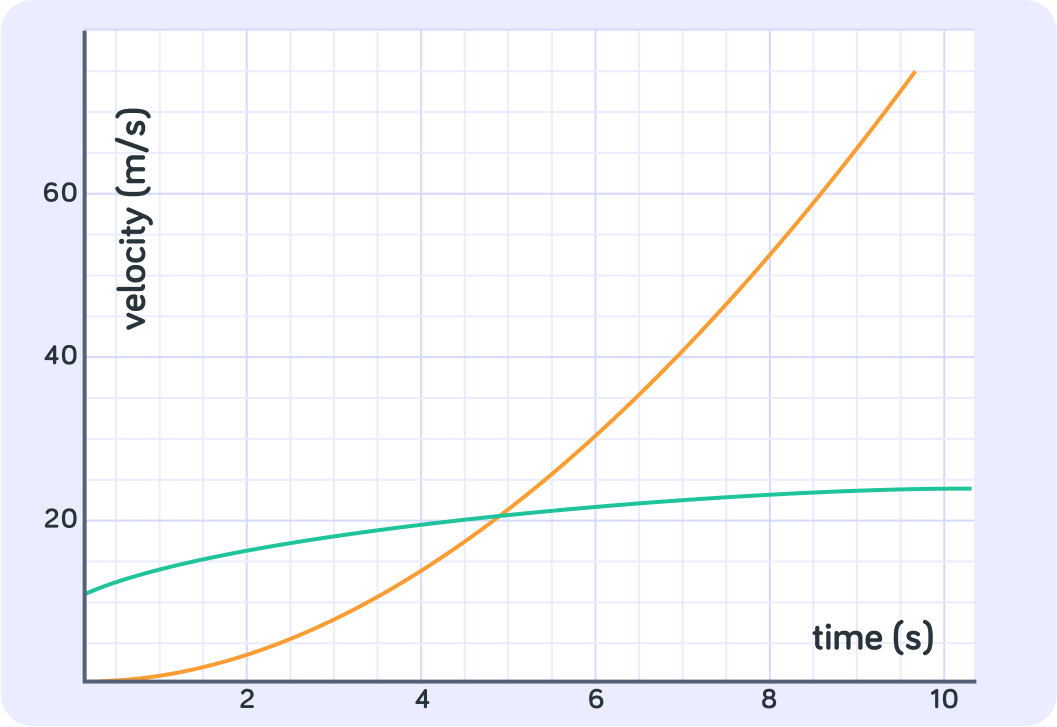
The green line shows an object which is still speeding up, but at a lower and lower rate
If a curve flattens out in a velocity/time graph, that just means that the object is going towards constant speed. It does not mean the object stops moving!
Are these examples of uniform acceleration?
So curved lines on a velocity/time graph show...
non-uniform acceleration.
Summary!
A velocity/time graph has velocity on the y-axis and time on the x-axis.
The gradient in a velocity/time graph is the same as acceleration , with units
A horizontal line means the object is moving at a constant speed
This is because it has no gradient, and thus no acceleration.
A constant positive gradient means...
the object has a positive uniform acceleration.
A constant negative gradient means...
the object has a uniform deceleration.
A line that curves upwards means the object is speeding up faster and faster.
Its acceleration is increasing, so it is non-uniform.
A line that flattens out means the object is still speeding up, but doing so at a slower and slower rate
Its acceleration is decreasing, so it is non-uniform.